Brief Summary
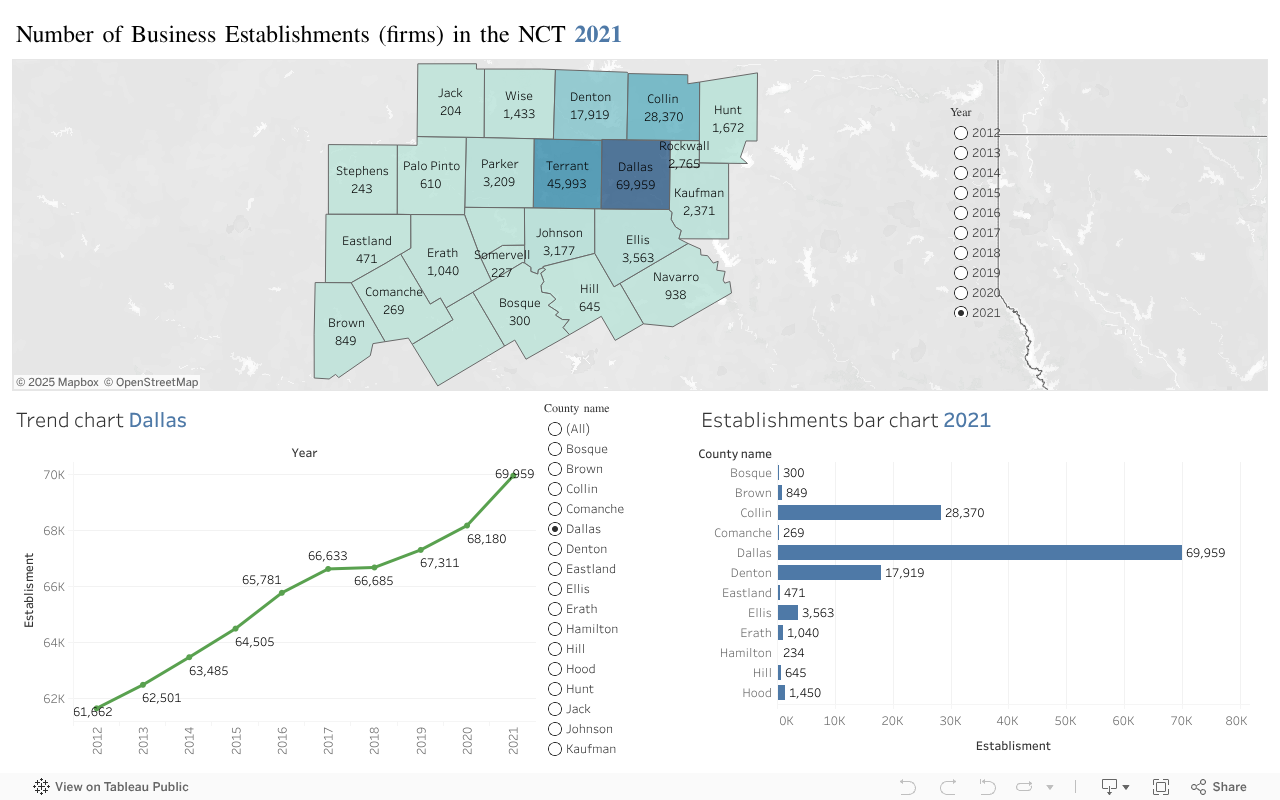
This dashboard visualizes the number of business establishments (firms) across the North Central Texas (NCT) region for the year 2021, alongside historical trends from 2012 to 2021. It includes a map view for spatial distribution, a trend line chart to observe changes over time, and a bar chart showing county-level comparisons for 2021.
Detailed Explanation
Map View (Top Section)
- Purpose: Displays a geographical distribution of business establishments by county in NCT for the selected year (2021).
- Interactive Feature:
- You can select a different year using the radio buttons on the right side to dynamically update the map.
- Darker shades indicate higher business establishment counts, with Dallas and Tarrant counties leading.
Trend Chart (Bottom Left)
- Purpose: Shows the growth of business establishments over time for the selected county.
- Default View: Displays trend for Dallas County from 2012 to 2021.
- Insight: Dallas County has seen steady growth—from 61,662 in 2012 to 69,959 in 2021.
- Interactivity: Select a county from the right-hand list to update the line chart with that county’s data.
Establishments Bar Chart (Bottom Right)
- Purpose: Ranks all counties in the region by the number of establishments in 2021.
- Insight:
- Dallas (69,959), Tarrant (45,993), and Collin (28,370) have the highest counts.
- Smaller rural counties like Somervell (227) and Comanche (269) have the lowest.
- Color-coded for visual differentiation.
Interactive Features Recap
- Map filters by year.
- Trend line updates based on county selection.
- Hovering provides detailed tooltips.
- Counties can be selected via radio buttons to explore their individual trends and stats.