Narcotics Usage and Prescription Trends in NCT
This interactive dashboard provides a multi-faceted view of narcotics-related prescription and usage patterns across 24 counties in Texas from 2014 to 2022. It is designed to help public health professionals, policymakers, and stakeholders identify areas with significant opioid activity and track annual trends in controlled substance distribution and impact.
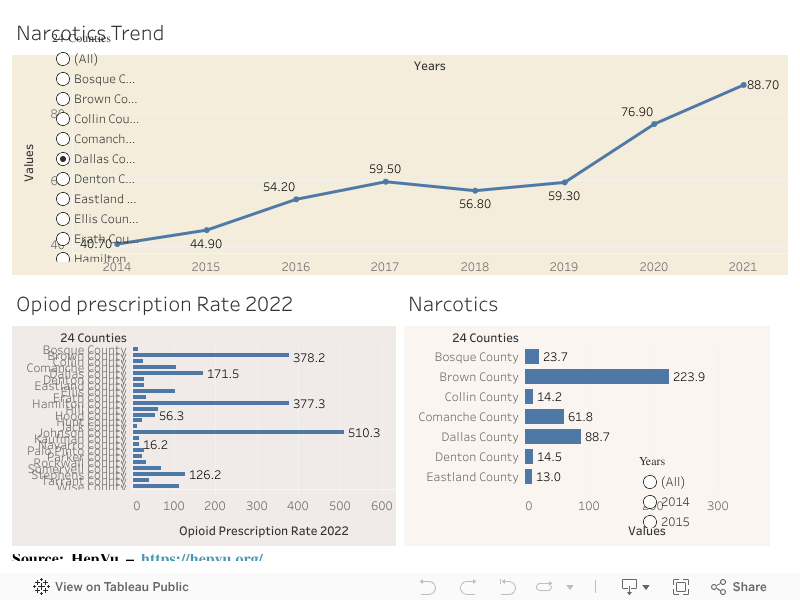
Top Panel: Narcotics Trend (2014–2021)
- This line chart shows the year-over-year average narcotics values (e.g., rates, dosage distribution, or similar metrics) across the selected counties.
- The values have risen consistently from 11.5 in 2014 to a peak of 25.2 in 2021.
- Notable increases:
- Sharp rise from 16.9 (2019) to 21.8 (2020), suggesting a potential spike during the pandemic.
- Consistent growth trend may indicate a growing opioid issue in the region.
- County selector (left) allows users to drill down into individual counties to view their specific trendline.
Bottom Left: Opioid Prescription Rate (2022)
- A horizontal bar chart ranks all 24 counties based on their prescription rate in 2022.
- Johnson County leads with a staggering rate of 510.3, followed by Brown County (378.2) and Hamilton County (377.3).
- Other counties with rates above 100 include:
- Collin, Comanche, Dallas, Erath, Ellis, Hill, and Wise
- This panel is useful for:
- Identifying prescribing hotspots
- Pinpointing counties that may need intervention or review of prescribing practices
Bottom Right: Narcotics Distribution by County and Year
- Another bar chart with year filter that allows users to assess changes in narcotics values per county over time.
- Default shows a comparison across counties for the selected year:
- In the sample year (likely 2021), Johnson County (202.8) and Hamilton County (154.7) again appear among the highest.
- This reinforces trends from the prescription chart, suggesting these counties have persistent high narcotics activity.
- Slider on the right lets users compare values from 2015 through 2021 to monitor historical changes.
Key Insights
 Upward trend in narcotics values suggests a continued increase in opioid-related activity in many counties.
 Certain counties (Johnson, Hamilton, Brown) show consistently high prescription rates and narcotics values, making them potential focus areas for health policy interventions.
 The dashboard provides a dynamic interface to explore trends both temporally (by year) and geographically (by county), enabling targeted analysis.
Recommendations
- Further investigate counties with highest year-over-year increases.
- Consider correlating this data with overdose rates, treatment availability, and prescription practices.
- Use this dashboard for resource planning, public health outreach, and opioid harm reduction strategies.