Housing Development and Family Structure Trends by County in NCT
This interactive Tableau dashboard provides a dual-perspective analysis of housing activity and family demographics across 24 counties in North Central Texas. It offers a geographic overview and trend insights for two key indicators:
Key Indicators Visualized
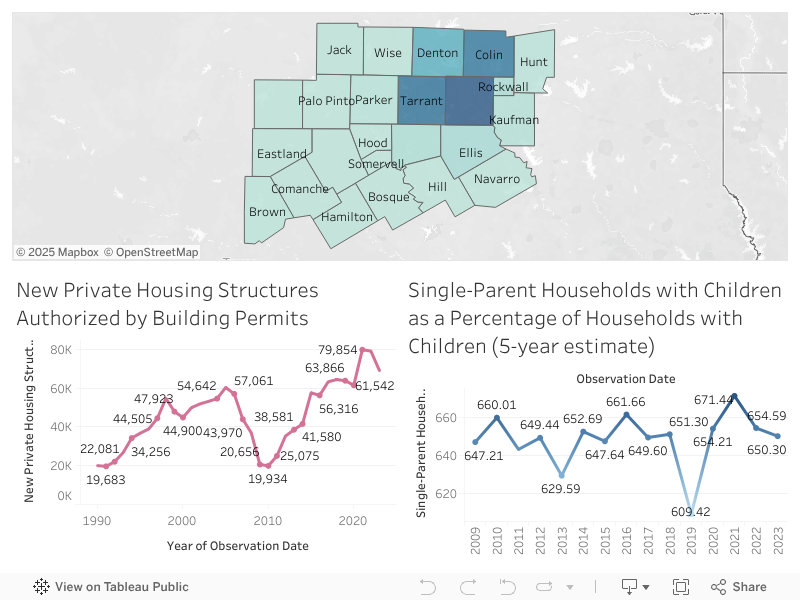
New Private Housing Structures Authorized by Building Permits
This line graph shows the total number of new private housing units approved annually from 1990 to 2023, reflecting residential development trends and construction surges over time.
- Notable Peaks: 2021 and 2022 mark historic highs with over 79,000 units authorized, indicating a significant post-pandemic housing demand.
- Dips: A sharp drop around 2009–2010 aligns with the national housing market crash and economic recession.
Single-Parent Households with Children (5-Year Estimate)
This chart tracks the total number of single-parent households with children across the region between 2009 and 2023, based on U.S. Census Bureau ACS data.
- The data reveals moderate year-to-year fluctuations, with a notable dip in 2020 likely influenced by data reporting delays or pandemic-related disruptions.
- The count rebounded in 2021 and peaked in 2022, indicating changes in family dynamics or migration patterns.
County-Level Heat Map
The map displays county-wise variations for a selected metric (e.g., new housing permits or single-parent households), helping users visualize which counties contribute most to the overall totals.
- Darker shades represent higher values, such as in Dallas, Tarrant, Collin, and Denton, which consistently show elevated housing or demographic figures.
- Lighter counties like Hamilton or Somervell typically reflect smaller population bases and lower permit volumes.
Interactive Features
- Map Selection: Click on a county to dynamically update the trend graphs to reflect only that county’s data.
- Time Series Exploration: Use the graphs to identify long-term changes, disruptions, or surges.
- County Comparisons: Quickly compare development intensity or demographic shifts across the region.
Use Cases
This dashboard supports:
- Urban planning and zoning decisions
- Socioeconomic and demographic research
- Policy development for housing and family services
- Funding justification and grant reporting for county-level programs