Income and Poverty Dynamics in NCT (2017-2021)
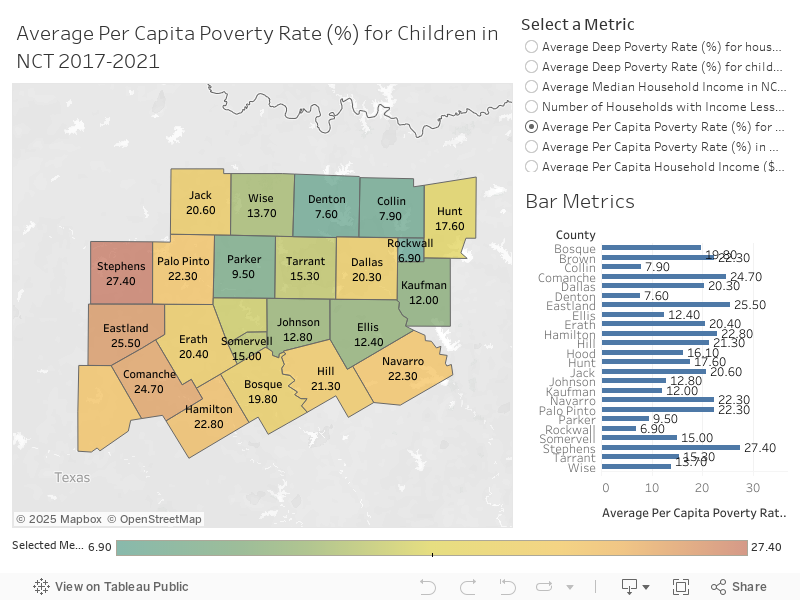
This interactive Tableau dashboard provides a comprehensive view of key socioeconomic metrics across 24 counties in North Central Texas (NCT) from 2017 to 2021. It combines geospatial analysis and bar chart visualizations to help policymakers, researchers, and stakeholders understand poverty rates, income distribution, and economic disparities at the county level.
📌 Key Features
✅ Geospatial Map Visualization – A color-coded county map highlighting disparities in economic conditions.
✅ Bar Chart Representation – A detailed breakdown of selected metrics for direct comparison across counties.
✅ Dynamic Metric Selection – Choose from multiple indicators, including poverty rates, median household income, and per capita income to explore different perspectives.
✅ Interactive Insights – The map and bar chart dynamically update based on the selected metric, providing a dual-layered analysis for deeper understanding.
🛠️ How to Use This Dashboard Effectively
🔹 Analyze County-Level Trends
• Hover over the map to view precise data for each county.
• Use the bar chart to compare counties side by side for a detailed breakdown.
🔹 Leverage the Metric Selection Panel
• Switch between different economic indicators to assess their impact across counties.
• Identify patterns in poverty rates, income disparities, and socioeconomic well-being.
🔹 Identify Trends & Disparities
• Observe how certain counties have higher deep poverty rates compared to others.
• Determine which regions show positive economic trends or require intervention.
🔹 Make Data-Driven Decisions
• Policymakers can allocate resources efficiently based on county-specific data.
• Organizations can identify high-need areas for community programs and assistance.
• Businesses can analyze income levels and economic conditions for strategic decision-making.
📊 Turning Insights into Action
With both map and bar chart visualizations, this dashboard provides a clear, data-driven perspective on North Central Texas’ economic landscape. Users can easily identify disparities, trends, and areas of improvement, making it a valuable tool for research, policymaking, and economic planning.