House Ownership in NCT
Overview
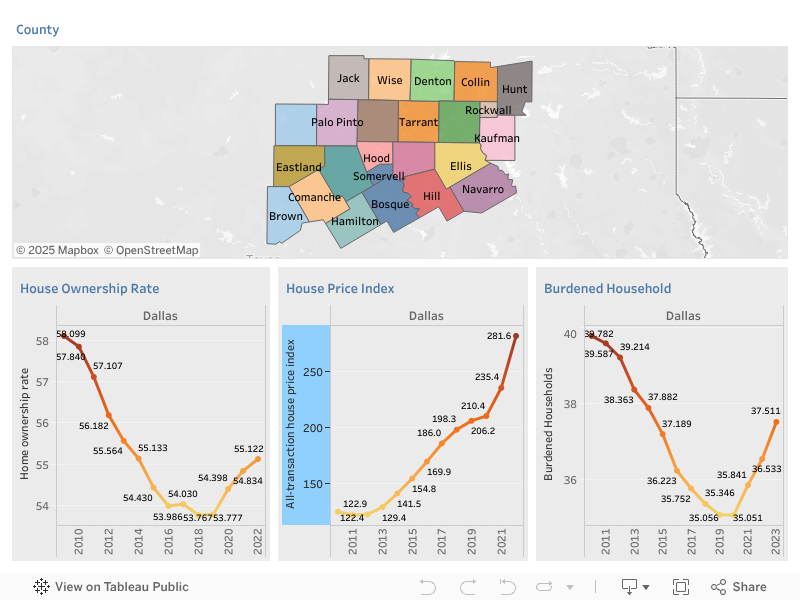
This interactive Tableau dashboard visualizes housing-related trends across 24 counties in North Central Texas, allowing users to explore how home ownership patterns, housing prices, and household burden have evolved over time.
The dashboard is designed to support regional housing analysis, urban planning, and policy development through data-driven insights.
Key Features
- Clickable County Map
Users can click on any county in the map to update all visualizations below with data specific to the selected region. - Three Interactive Trend Graphs:
- Home Ownership Rate (2009–2022)
Tracks the percentage of owned housing units over time, showing fluctuations in home ownership levels. - House Price Index (2010–2022)
Displays the all-transaction house price index, reflecting trends in housing market valuation. - Burdened Households (2010–2022)
Shows the number of households spending a disproportionate share of income on housing, indicating financial stress levels among residents.
- Home Ownership Rate (2009–2022)
- County-Level Focus
Selecting a county highlights its name and updates all three charts to show that county’s historical data. - Dynamic Tooltips & Labels
Data points are labeled for clarity, and hover-over tooltips provide exact values.
Key Observations from the Dashboard (Example: Dallas County)
- Home Ownership Rate in Dallas has gradually declined from around 58% in 2009 to ~55% in 2022, reflecting urban rental growth and affordability issues.
- The House Price Index in Dallas has surged significantly, from ~122.4 in 2010 to 281.6 in 2022, indicating rapid market appreciation.
- The Burdened Households metric remains relatively stable, hovering around 35,000–40,000, suggesting persistent cost-of-living challenges.
Insights & Applications
- Policy Planning
Identify counties with rising housing prices and stagnant ownership to target with affordable housing strategies. - Regional Comparison
Easily compare rural vs. urban counties in terms of home ownership challenges and price acceleration. - Community Development
Use burdened household data to guide grant applications, social services, or local infrastructure planning. - Public Awareness
Offer residents, researchers, and decision-makers a transparent look at housing affordability and equality trends.
How to Use the Dashboard
- Click on a county in the map to update all visualizations.
- Use the county filter on the right to compare multiple counties.
- Hover over any line graph to see exact values by year.