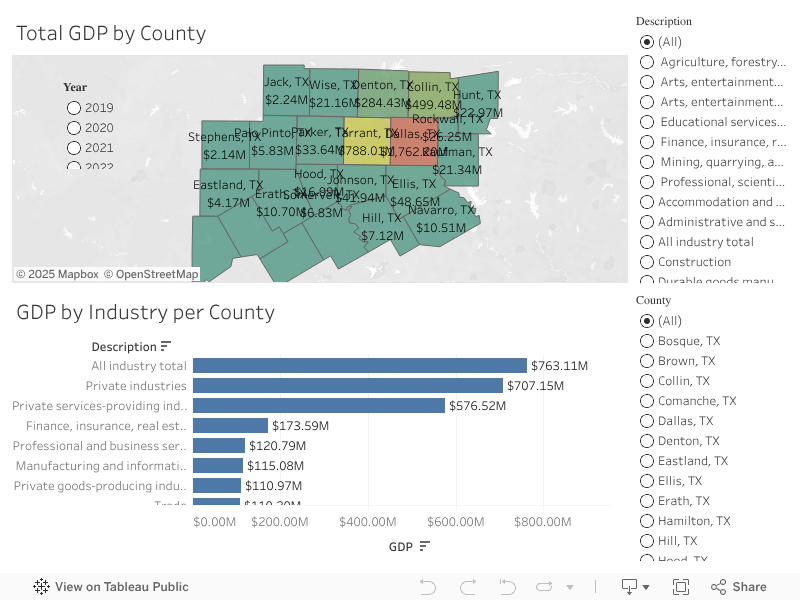
GDP Distribution Across NCT Counties
This dashboard provides a comprehensive visualization of GDP distribution across counties in North Central Texas (NCT) for selected years.
Key Components:
- Total GDP by County (Map View)
- Shows GDP values by county and highlights regional economic differences.
- Interactive year filter updates the map and bar chart dynamically.
- GDP by Industry per County (Bar Chart)
- Displays GDP contributions by industry type within the selected counties.
- Filter options on the right allow users to view by specific industry types and counties for granular analysis.
Interactive Features:
- Year filter updates both map and bar chart.
- County and industry filters allow deep-dives into specific sectors or regions.
- Tooltips provide exact GDP values for detailed comparison.