New Business Applications Overview (2019–2023)
The number of business applications here refers to the core applications series corresponding to the basic filtering of Employer Identification Number (EIN) applications except for applications for tax liens, estates, trusts, certain financial filings, and applications outside of the 50 states and D.C. or with no state-county geocodes. This data comprises the number of new applications, including filling to key sectors (agriculture, forestry, fishing, and hunting) or public administration and applications in certain industries (e.g., private households and civic and social organizations).
Further analysis and discussion of the data can be found in the Center’s newsletter, available at this link.
This interactive Tableau dashboard provides a county-level analysis of new business applications across the North Central Texas region. It is designed to support regional economic development assessments by enabling detailed, visual exploration of business trends over a 5-year period.
Key Visual Components
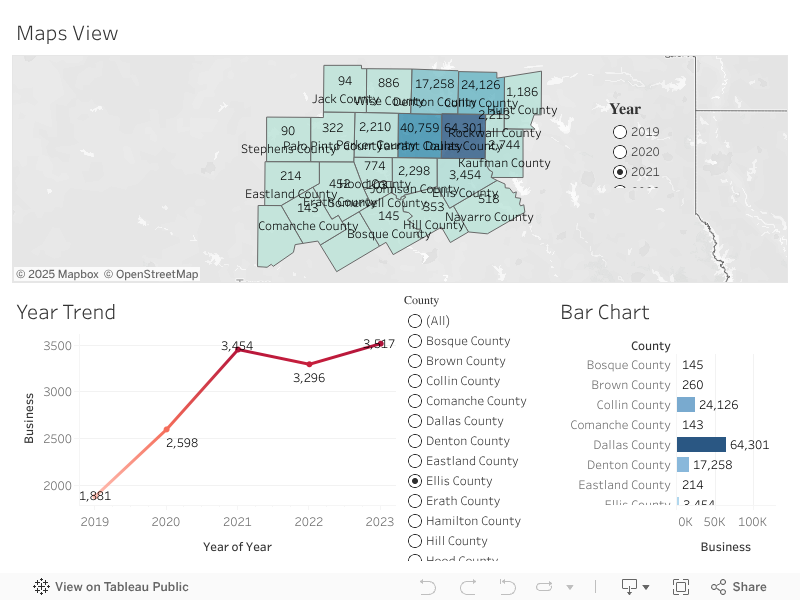
1. Map View (Top Section)
- Purpose: Visualizes the distribution of new business applications across all counties.
- Color Intensity: Darker shades represent counties with higher application volumes.
- Interactive Filter: The Year selector allows users to view county-wise business application data for a specific year from 2019 to 2023.
- Hover Tooltip: Shows the total number of business applications for each county in the selected year.
2. Year Trend Line Chart (Bottom Left)
- Purpose: Displays the annual growth of business applications across years.
- Y-Axis: Number of businesses
- X-Axis: Year
- Color Gradient: Darker red indicates higher values in more recent years.
- Interactivity: County selector lets the user isolate the trend for an individual county.
3. Bar Chart (Bottom Right)
- Purpose: Compares total business application counts by county for the selected year.
- Sorted View: Makes it easy to identify counties with highest and lowest applications.
- Highlighting: Upon selection of a county from the filter or map, that county is highlighted.
Key Insights
- Dallas County had the highest business application volume in the most recent year (57,863), followed by Tarrant and Collin counties.
- Rural counties such as Somervell and Hamilton had the lowest counts but show consistent year-over-year growth.
- The year trend line shows a steady increase in applications from 2019 (65) to 2023 (124), indicating positive regional economic momentum.
- The map provides a quick snapshot of regional economic hotspots.