Citizenship Status & Foreign-Born Population (2014–2023)
Purpose
Track changes in the size and share of the U.S. foreign-born population over time and compare geographies (U.S., Texas, and MSAs). The view pairs absolute counts with percent share so trends can be interpreted both ways.
What’s in the dashboard
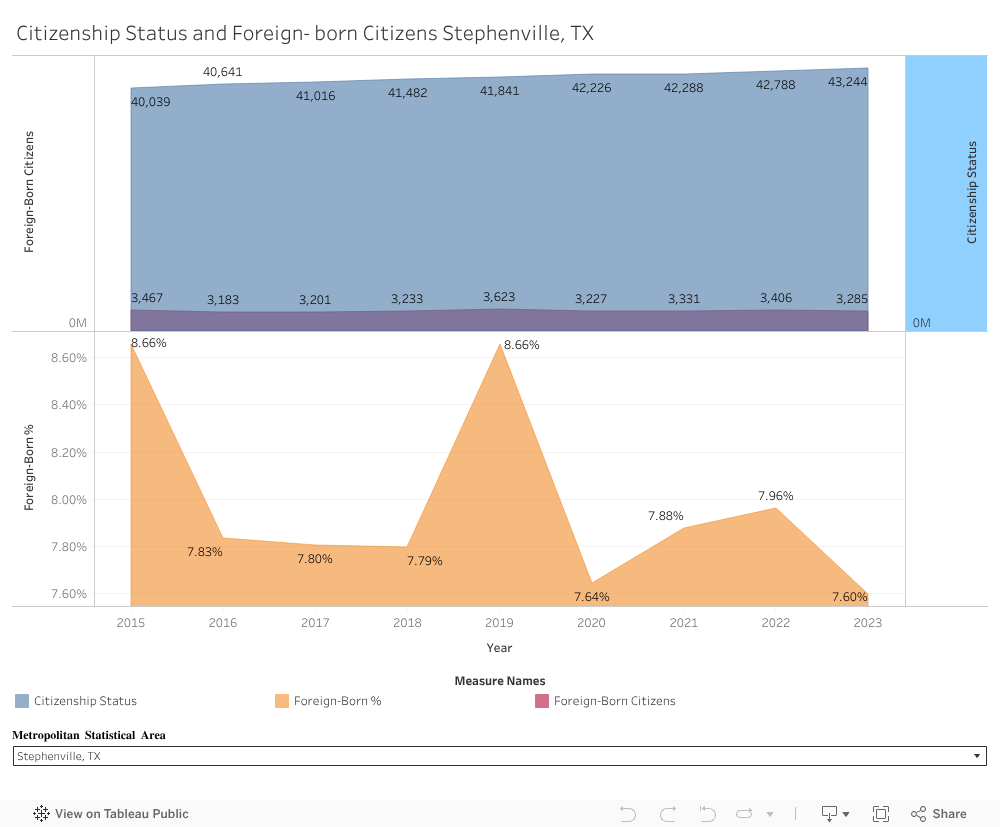
- Top panel (stacked/area with dual axis):
- Foreign-Born Citizens (count) on the left axis.
- Total population/citizenship status (count) on the right axis.
- Year labels show levels and change.
- Bottom panel (line): Foreign-Born % of total population by year.
- Filters: MSA selector (United States, Texas, and individual MSAs). Use it to localize the same time-series.
- Tooltips & labels: Values for each year; use hover for precise numbers.
Key findings (United States view, 2014 → 2023)
- Foreign-born citizens grew from ~41.74M to ~45.82M, an increase of ~4.08M (about 9–10% growth).
- Total population rose from ~316.52M to ~332.39M (+15.87M, about 5%).
- Because the foreign-born count grew faster than the total, the foreign-born share increased from 13.19% to 13.79% (+0.60 percentage points, ~4.6% relative rise).
- The share shows steady gains through 2019, a mild dip around 2020–2022, then a notable uptick in 2023.
(When you switch to Texas or a specific MSA, use the same logic to compare local growth vs. national.)
How to read & use it
- Start at the % line to see direction and turning points; confirm with counts above.
- Change the MSA filter to see whether local trajectories move with or against the national trend.
- Compare slopes: a steeper slope in the top panel for “Foreign-Born Citizens” than for total population indicates rising share.
- Annotate inflection years (e.g., 2016–2019 rise, 2020–2022 softness, 2023 rebound) for your research notes.
Methods & definitions (for your write-up)
- Measures:
- Foreign-Born Citizens: number of residents born outside the U.S. who are citizens (by birth/adoption/derivation/naturalization, per source definitions).
- Citizenship Status (Total): total counted population (used as denominator for the %).
- Foreign-Born %:
Foreign-Born Citizens / Total Population.
- Timebase: Annual series 2014–2023 (latest available year in the file).
- Geography: United States, Texas, and selected MSAs (filter control).
- Computation tips in Tableau: KPIs for the latest year should use either a Latest-Year filter or aggregate-safe LOD to avoid mixing aggregate/non-aggregate errors.
Caveats
- If the source is ACS or similar sample data, margins of error apply; year-to-year wiggles near flat periods may not be statistically meaningful.
- Definition check: ensure “Citizenship Status” series and the denominator used for the percent are consistent across geographies/years.
- Pandemic effects: 2020–2021 collection/coverage issues may affect levels.
Questions this dashboard enables
- Did Texas (or a given MSA) outpace the national growth in foreign-born share? By how much?
- Which MSAs show persistent increases vs. post-pandemic rebounds only?
- Are changes driven more by absolute inflows (count rising quickly) or by slower growth in total population?
- What policy or economic events line up with the inflection points (e.g., visa rules, labor demand, pandemic recovery)?
Suggested extensions (optional)
- Top-N MSA leaderboard for the selected year by Foreign-Born %.
- YoY change labels/arrows on the line chart for quick comparison.
- Annotations on notable years (policy changes, 2020/2021 data caveats).
- KPI cards: Latest-year Foreign-Born Citizens, Foreign-Born %, and YoY change.