Veteran vs Non-Veteran Summary in NCT
Socioeconomic Comparison Across 24 North Central Texas (NCT) Counties – 2023
This Tableau dashboard offers a comprehensive county-level comparison between veterans and non-veterans across 24 counties in the North Central Texas region. The dashboard leverages U.S. Census Bureau data to visualize disparities and commonalities in demographics, education, employment, income, and social well-being.
It serves as a valuable resource for researchers, policymakers, and university stakeholders interested in understanding the socioeconomic status of veterans relative to their non-veteran counterparts across multiple dimensions.
Dashboard Features
- Interactive County Selector – Enables dynamic filtering by individual counties for localized insight.
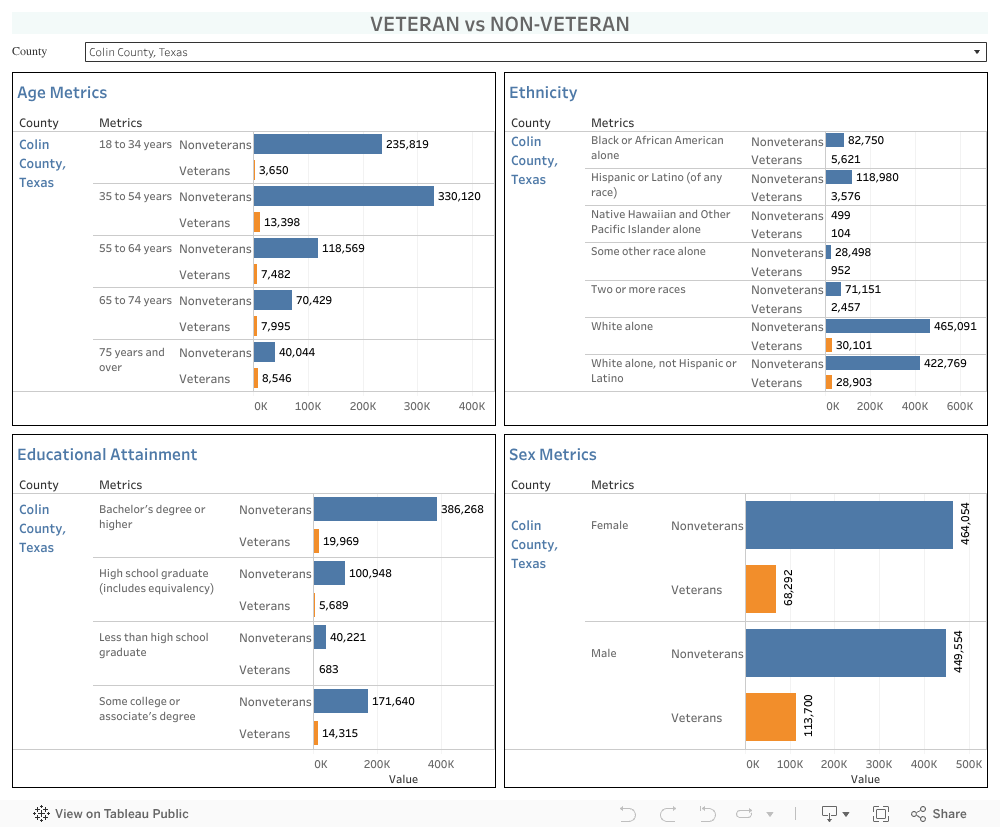
- Segmented Visualization – Each metric is split by veteran and non-veteran status, displaying both absolute values and percentage distributions.
- Color-coded Panels – Help differentiate between metric types and enhance readability.
- Multi-panel Design – Eight key metric groups across two levels: count-based and percentage-based visualizations.
Key Metrics & Insights
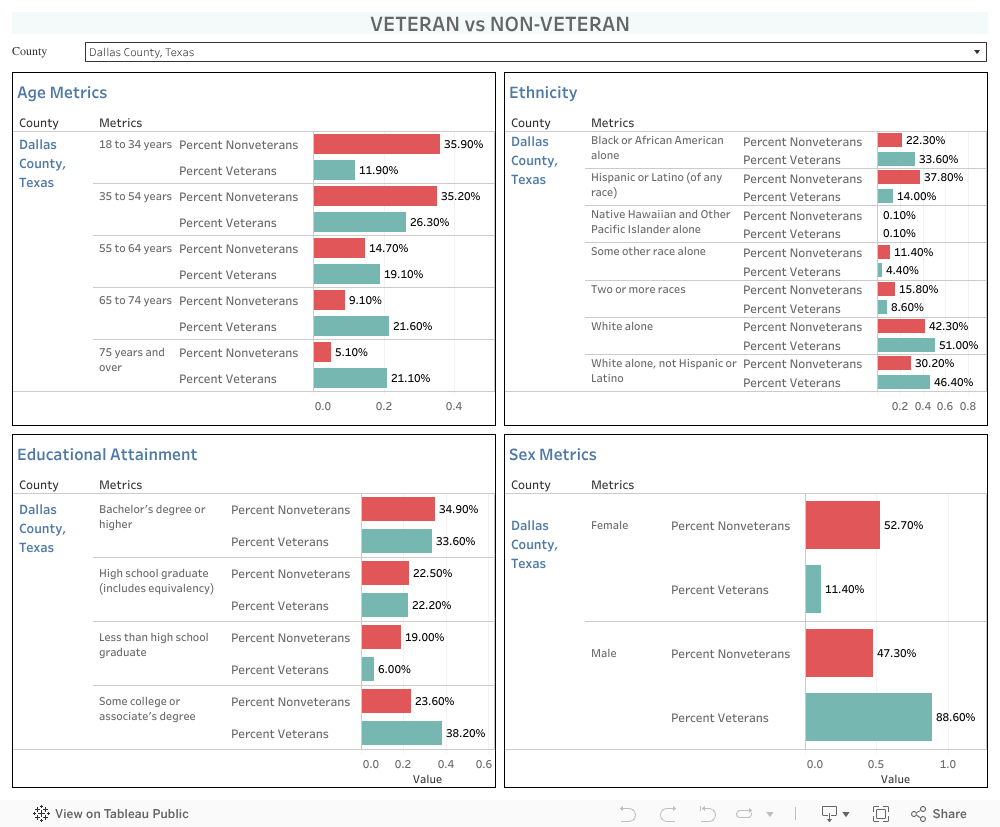
1. Age Distribution
- Veterans are heavily represented in the 35–74 age range, with the highest share in the 55–64 bracket.
- Non-veterans dominate the younger age categories (18–34 years).
- Reflects the aging veteran population and post-service entry into mid-career age brackets.
2. Ethnicity
- Veterans are majority White alone, with comparatively lower proportions of Black, Hispanic, and Asian individuals.
- Non-veterans are more ethnically diversified, particularly with higher Hispanic and African American representation.
- These trends may reflect historical military enrollment patterns and access to veteran services.
3. Educational Attainment
- Veterans have a higher share with associate’s degrees or some college, reflecting the impact of GI Bill benefits.
- Non-veterans have a greater percentage with less than high school or only high school diplomas.
- Both groups show similar levels for Bachelor’s degree or higher, suggesting post-service education is effectively leveraged.
4. Metrics Between Male and Female
- Veterans are overwhelmingly male (typically >85%), while non-veterans show a near-balanced or female-majority distribution.
- Female veterans remain a small but present minoritized group, highlighting the need for female-specific services and outreach.
5. Employment Metrics
- Labor force participation rates are nearly equal (79–80%) for both groups.
- Unemployment is slightly lower among veterans (e.g., 4.0% vs. 4.8%), indicating strong workforce integration.
- The total civilian labor force remains much larger for non-veterans due to population size.
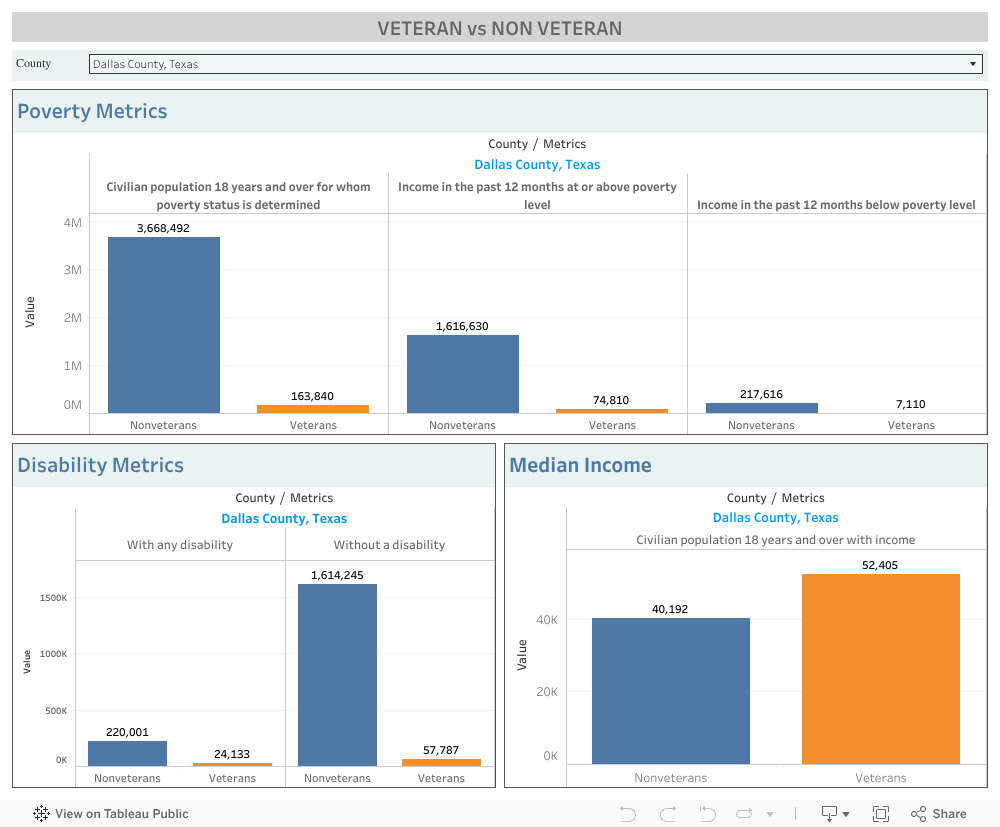
6. Income Metrics
- Median income is higher among veterans in most counties (e.g., $52,405 vs. $40,192 in Dallas County).
- Suggests greater job stability, veteran preference hiring policies, and access to benefits as contributing factors.
7. Poverty Metrics
- Veterans experience significantly lower poverty rates than non-veterans.
- For example, in Dallas County:
Nonveterans below poverty: 217,616
Veterans below poverty: 7,110 - This underscores the economic resilience of veterans, supported by VA services and job readiness programs.
8. Disability Metrics
- Veterans are more likely to have a disability (due to service-related conditions), yet many still participate in the workforce.
- Non-veterans have fewer reported disabilities, but this is also related to age distribution.
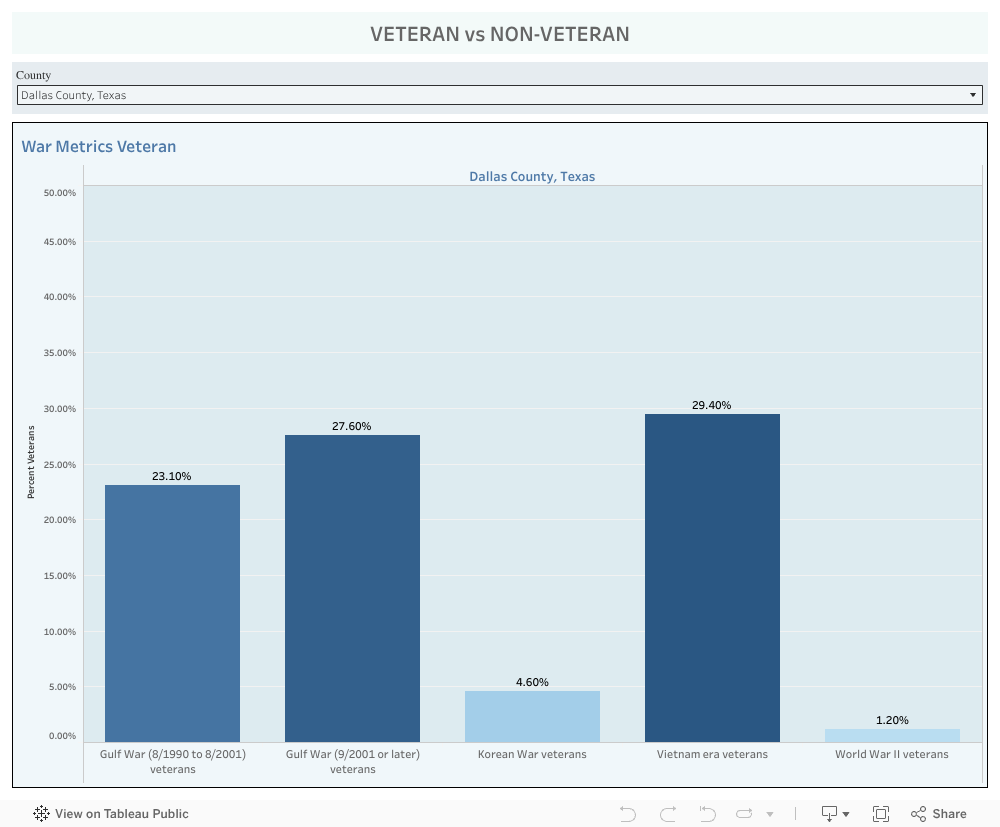
9. War Metrics by Conflict Era (County-Level View)
This dashboard provides a breakdown of veteran population percentages across different eras of service for a single selected county within the 24-county North Central Texas (NCT) region. The current view displays data for Dallas County, Texas, but users can filter the dashboard to view similar statistics for each of the other 23 counties.
Key Insights for Dallas County:
- Vietnam Era Veterans make up the largest group at 29.4%.
- Gulf War (2001 or later) veterans follow closely at 27.6%, indicating a younger veteran segment.
- Gulf War (1990–2001) veterans constitute 23.1%.
- Korean War Veterans represent 4.6% of the veteran population.
- World War II Veterans make up just 1.2%, reflecting the natural aging of that group.
Purpose & Utility:
This visualization helps:
Support public service planning and veteran resource allocation across NCT’s 24 counties.
Highlight the generational distribution of veterans in each county.
Identify trends to better tailor veteran services at the county level.
How to Use the Dashboards
- Step 1: Use the County dropdown to select one of the 24 NCT counties.
- Step 2: Explore the eight metric panels: Age, Ethnicity, Education, Male or Female, Employment, Income, Poverty, and Disability.
- Step 3: Switch between Count and Percent dashboards to gain a full understanding of both scale and proportion.
- Step 4: Compare trends across groups and counties to identify areas needing policy attention or further research.
Key Takeaways
- Veterans in North Central Texas tend to:
- Be older, predominantly male, and majority White.
- Have higher median incomes and lower poverty rates.
- Maintain strong labor force participation and employment rates.
- Be more likely to have service-related disabilities.
- Benefit from educational incentives like the GI Bill.
- Non-veterans display:
- Broader diversification in age, male or female, and ethnicity.
- Lower income levels and higher poverty rates.
- Slightly higher unemployment.
- Greater representation of undereducated and economically vulnerable groups.