Commercial Real Estate in NCT
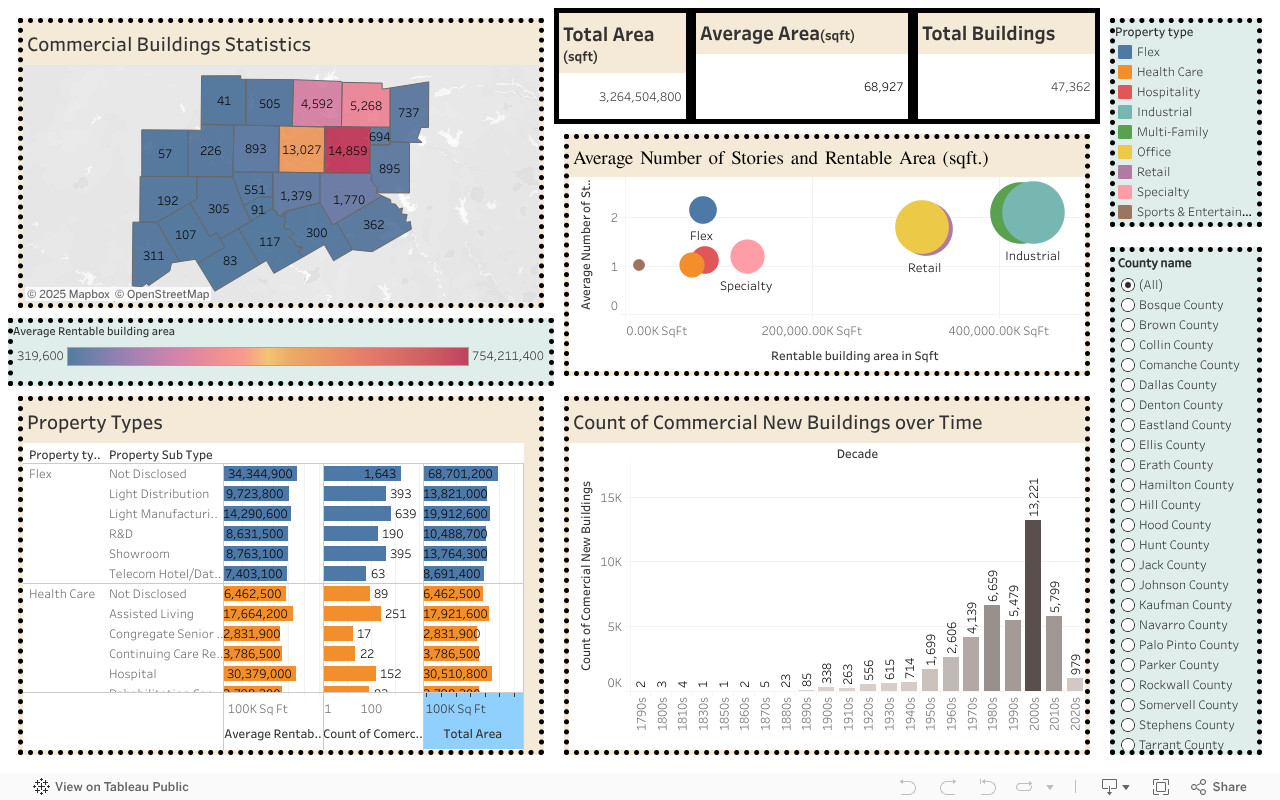
The dashboard shows a big picture of the region’s built space. Right now it totals about 3.26 billion sq ft spread across roughly 47,000 buildings, with an average size near 69,000 sq ft per building. That means the market is dominated by many mid-to-large facilities rather than lots of tiny ones.
Where the space sits. The map highlights which counties hold the most space—darker shades = more total square footage. A few counties clearly carry a larger share of the region’s buildings and floor area, forming the core of activity, while others play a smaller supporting role.
What kinds of buildings dominate. The mix is led by Industrial (distribution and warehouse-type space) and Multi-Family (apartments). These two categories account for the biggest slice of total space. Office and Retail are also sizable contributors, while Health Care and Specialty uses appear smaller but still meaningful. Within each type, a handful of subtypes carry most of the weight—for example, apartments within Multi-Family, distribution/warehouse within Industrial, and hospitals within Health Care.
How buildings are shaped. The bubble chart compares total space (left-to-right) with average height in stories (bottom-to-top).
- Industrial and Retail bubbles sit far to the right but lower on the chart: very large footprints, usually low-rise.
- Multi-Family and some Office bubbles sit higher: taller buildings that stack space vertically.
- Health Care and Specialty tend to be smaller overall, with height and size varying by subtype.
When they were built. The timeline shows the biggest wave of construction in the 2000s, with strong growth in the 1990s and a slower 2010s–2020s period. That pattern fits what you’d expect post-recession and into the pandemic years. A small “Unknown” bar reflects records without a reliable build year.
What this means at a glance.
- The region’s economy leans heavily on logistics/industrial space and housing (apartments), with office/retail supporting that base.
- The form factor is mixed: lots of wide, single- to mid-story buildings for industrial and retail, and taller structures where people live or work (apartments and offices).
- The 2000s boom left a large stock of relatively newer buildings; the most recent decade adds space, but at a slower pace.
How to read changes by place or type. Look for counties that darken on the map and check which property types rise in the table for those places. If a county’s bubble for Industrial sits far right on the size-vs-height chart, it’s a logistics-heavy county; if Multi-Family sits higher, it’s adding more vertical residential space.
In short: a logistics- and housing-led market, built out most strongly in the 1990s–2000s, with taller space concentrated in apartments and some offices, and large, low-rise footprints in industrial and retail.