Comprehensive Insurance Coverage
This project presents a robust set of interactive Tableau dashboards analyzing health insurance coverage characteristics for 12 counties in North Central Texas, with county-level filters and selectable metrics. Together, these dashboards deliver critical insights for local governments, public health agencies, insurers, employers, and community organizations to identify gaps, design targeted programs, and predict future needs.
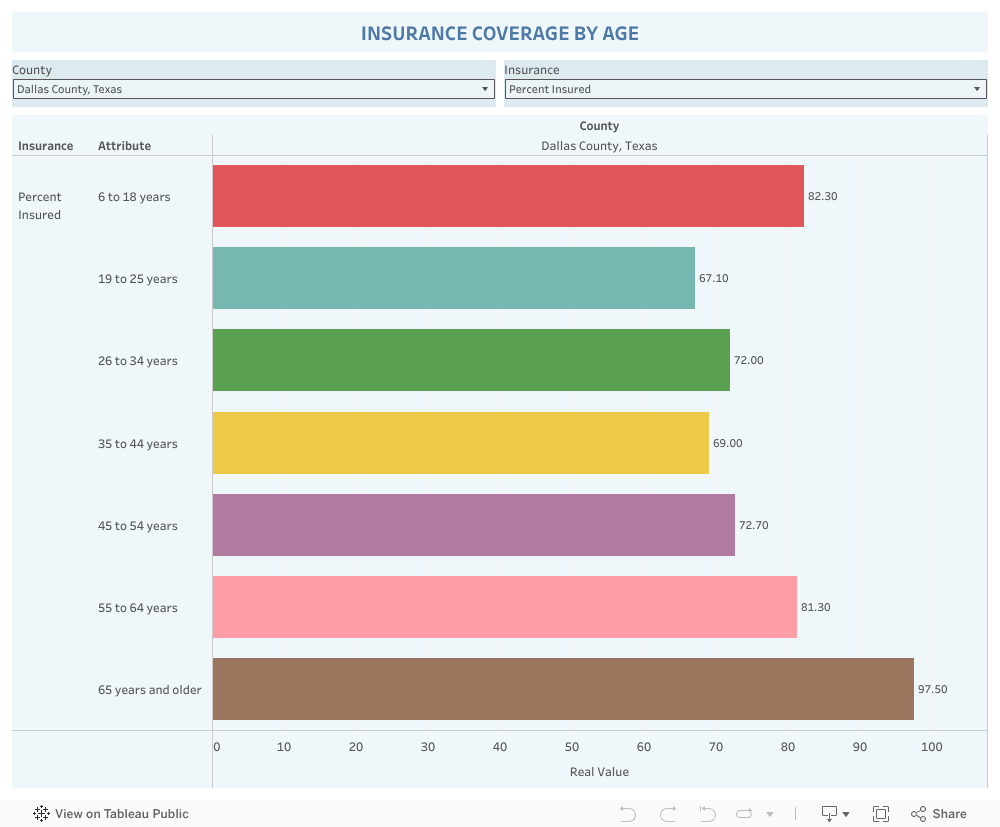
Insurance Coverage by Age
What it shows:
A breakdown of insured (and optionally uninsured) populations by age groups:
- 6 to 18 years
- 19 to 25 years
- 26 to 34 years
- 35 to 44 years
- 45 to 54 years
- 55 to 64 years
- 65 years and older
Purpose:
Visualizes how coverage varies as people age — highlighting critical groups that may age out of parental or dependent coverage.
Who uses it:
Public health officials, school districts, student health programs, senior services.
Insurance Coverage by Ethnicity
What it shows:
Coverage distribution for diversified racial and ethnic groups:
- White alone
- White alone, not Hispanic or Latino
- Hispanic or Latino (of any ethnicity)
- Black or African American alone
- Asian alone
- American Indian and Alaska Native alone
- Native Hawaiian and Other Pacific Islander alone
- Two or more ethncities
- Some other ethnicity alone
Purpose:
Highlights disparities among racial and ethnic groups, supporting targeted fairness initiatives and culturally relevant outreach.
Who uses it:
Heterogeneity and fairness offices, community organizations, public health policy teams.

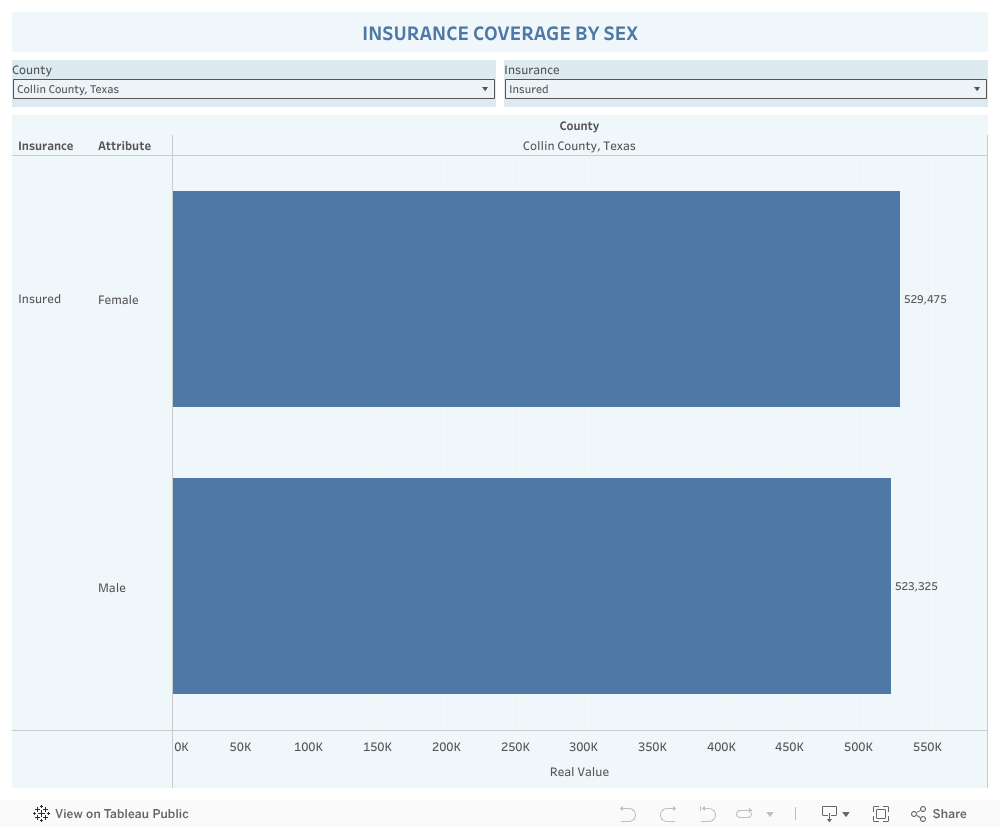
Insurance Coverage by Male or Female
What it shows:
Comparison of insurance coverage between males and females.
Purpose:
Detects potential coverage gaps based on male or female that could reflect workforce participation differences, employer benefit disparities, or barriers to enrollment.
Who uses it:
HR teams, women’s health advocates, benefits administrators.
Insurance Coverage by Poverty Status & Economic Status
What it shows:
Coverage by income brackets relative to the federal poverty threshold:
- Below 100%
- Below 138%
- 138%–399%
- 400% and above
Purpose:
Identifies how income levels correlate with access to insurance, which is vital for targeting Medicaid expansion, subsidies, or charity care.
Who uses it:
Policy analysts, social services, Medicaid administrators.

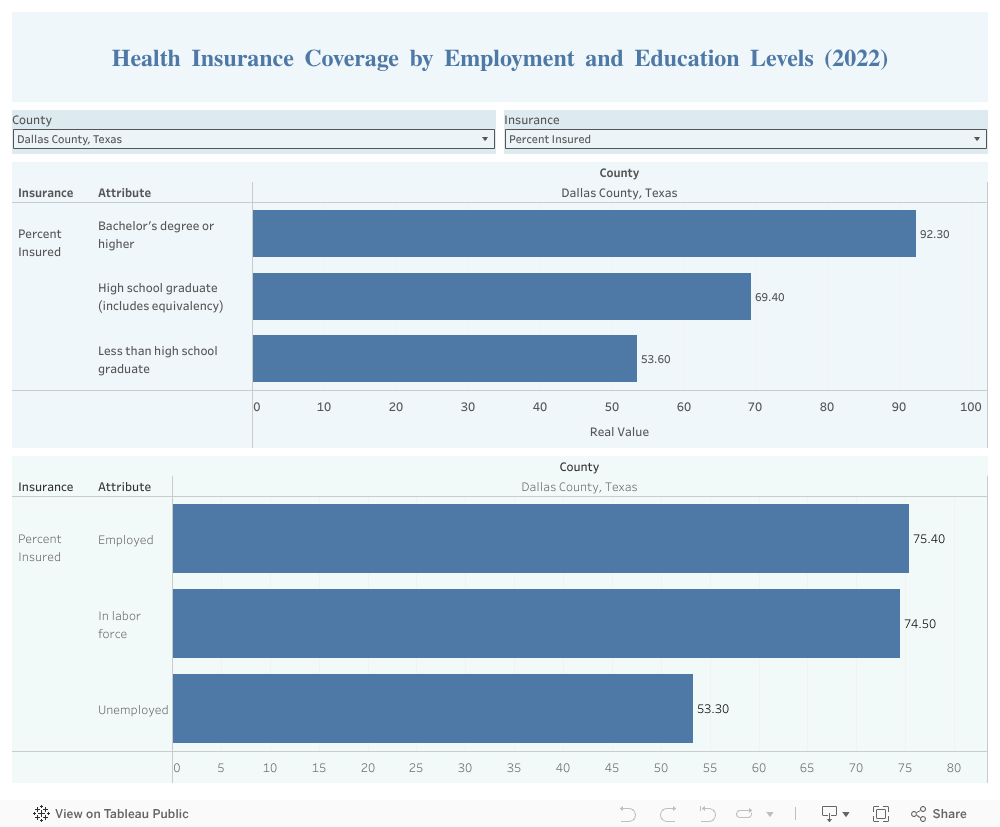
Insurance Coverage by Employment and Education Level
What it shows:
Education:
- Less than high school graduate
- High school graduate (includes equivalency)
- Bachelor’s degree or higher
Employment:
- Employed
- In labor force
- Unemployed
Purpose:
Reveals how education and employment status influence insurance coverage, helping with workforce development plans and adult education outreach.
Who uses it:
Workforce boards, community colleges, economic development offices.
Insurance Coverage by Disability Status
What it shows:
Comparison of coverage among those with or without a disability.
Purpose:
Brings attention to possible barriers for disabled residents, supporting accessible benefits programs and special assistance outreach.
Who uses it:
Social services, disability advocates, local governments.

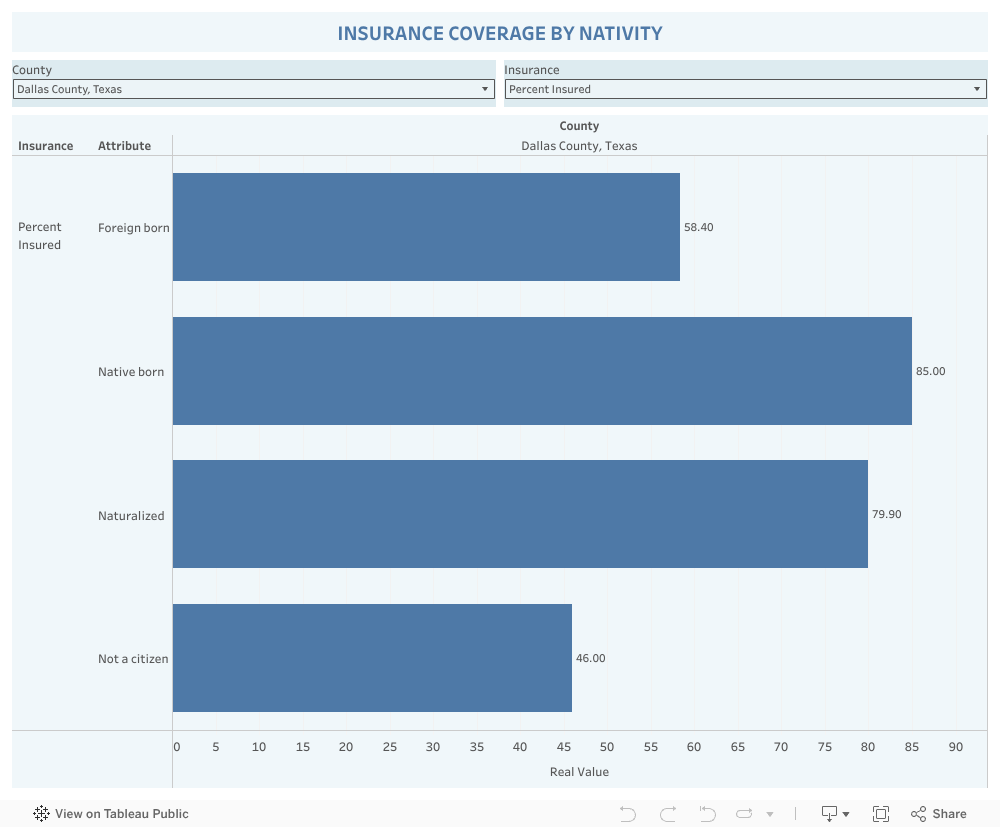
Insurance Coverage by Nativity
What it shows:
Breakdown by nativity:
- Native born
- Foreign born
- Naturalized citizens
- Not citizens
Purpose:
Shows how insurance coverage levels differ for immigrants and non-citizens, a key factor for local immigrant resource groups and policy design.
Who uses it:
Immigrant community organizations, local policymakers, non-profits.
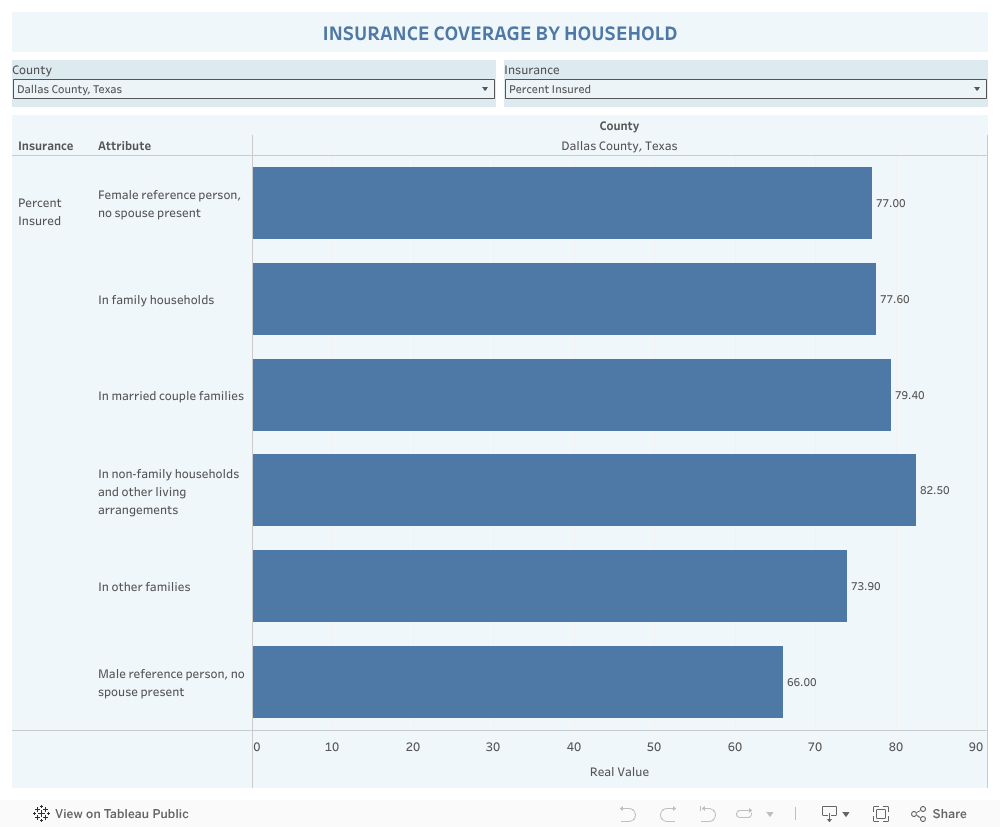
Insurance Coverage by Household
What it shows:
Coverage by household type:
- In married couple families
- In family households
- In non-family households and other living arrangements
- In other families
- Female reference person, no spouse present
- Male reference person, no spouse present
Purpose:
Reveals how living arrangements affect insurance rates — critical for social planners, family services, and affordable housing advocates.
Who uses it:
Social policy analysts, family resource centers, housing authorities.
Counties Covered
Your dashboards provide selectable data for:
- Collin County, Texas
- Dallas County, Texas
- Denton County, Texas
- Tarrant County, Texas
- Johnson County, Texas
- Ellis County, Texas
- Hood County, Texas
- Hunt County, Texas
- Parker County, Texas
- Rockwall County, Texas
- Wise County, Texas
- Kaufman County, Texas
Combined Value
Together, these dashboards form a powerful toolkit to:
- Pinpoint who is underinsured or uninsured by demographic, household, or economic factors.
- Predict which groups may need expanded services, outreach, or subsidies.
- Support grant applications and local funding by providing clear, credible data.
- Equip policymakers and health providers to close gaps in a data-driven, fair way.
Actionable Recommendations
 1. Publish & Share:
Embed the dashboards in public-facing sites for local governments, schools, health agencies, or non-profits.
2. Use for Grant Writing:
Incorporate the visuals and metrics into funding proposals for community health grants or local outreach programs.
3. Drive Community Outreach:
Use ethnicity, nativity, and poverty breakdowns to design culturally appropriate, language-accessible campaigns.
4. Train Local Teams:
Provide short trainings to local decision-makers so they can run custom filters by county and attribute to answer their own questions.
5. Refresh Data Annually:
Update the dashboards with the latest census and insurance data to keep trends current and maintain credibility.
6. Report Outcomes:
Track changes over time to see how outreach or policy changes impact coverage levels — use this for accountability reporting.