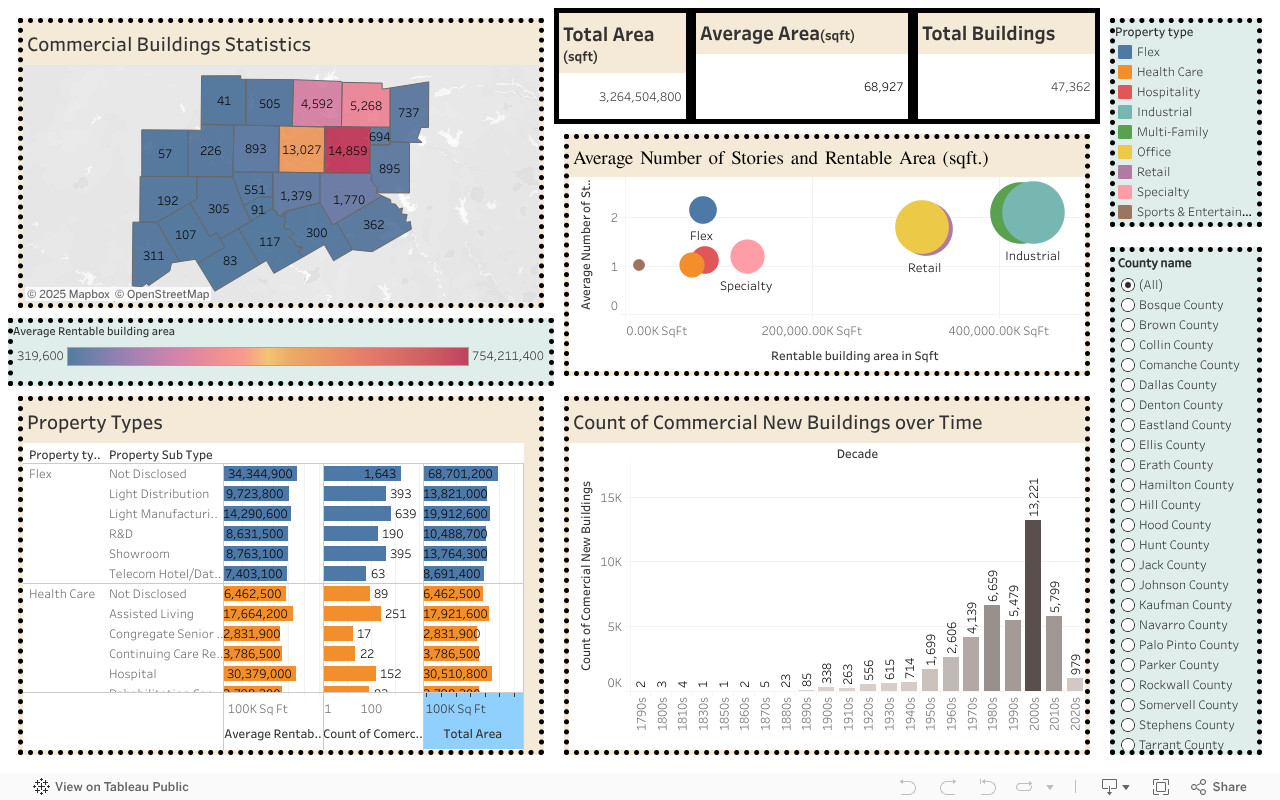
{"id":5727,"date":"2025-09-12T15:58:15","date_gmt":"2025-09-12T15:58:15","guid":{"rendered":"https:\/\/www.tarleton.edu\/tieuc\/?page_id=5727"},"modified":"2025-09-12T16:00:27","modified_gmt":"2025-09-12T16:00:27","slug":"commercial-real-estate-in-nct","status":"publish","type":"page","link":"https:\/\/www.tarleton.edu\/tieuc\/dashboards\/commercial-real-estate-in-nct\/","title":{"rendered":"Commercial Real Estate in NCT"},"content":{"rendered":"\n<h3 class=\"wp-block-heading\">Commercial Real Estate in NCT<\/h3>\n\n\n\n<p>The dashboard shows a big picture of the region\u2019s built space. Right now it totals about&nbsp;<strong>3.26 billion sq ft<\/strong>&nbsp;spread across roughly&nbsp;<strong>47,000 buildings<\/strong>, with an&nbsp;<strong>average size near 69,000 sq ft<\/strong>&nbsp;per building. That means the market is dominated by many mid-to-large facilities rather than lots of tiny ones.<\/p>\n\n\n\n<p><strong>Where the space sits.<\/strong>&nbsp;The map highlights which counties hold the most space\u2014<strong>darker shades = more total square footage<\/strong>. A few counties clearly carry a larger share of the region\u2019s buildings and floor area, forming the core of activity, while others play a smaller supporting role.<\/p>\n\n\n\n<p><strong>What kinds of buildings dominate.<\/strong>&nbsp;The mix is led by&nbsp;<strong>Industrial<\/strong>&nbsp;(distribution and warehouse-type space) and&nbsp;<strong>Multi-Family (apartments)<\/strong>. These two categories account for the biggest slice of total space.&nbsp;<strong>Office<\/strong>&nbsp;and&nbsp;<strong>Retail<\/strong>&nbsp;are also sizable contributors, while&nbsp;<strong>Health Care<\/strong>&nbsp;and&nbsp;<strong>Specialty<\/strong>&nbsp;uses appear smaller but still meaningful. Within each type, a handful of&nbsp;<strong>subtypes<\/strong>&nbsp;carry most of the weight\u2014for example, apartments within Multi-Family, distribution\/warehouse within Industrial, and hospitals within Health Care.<\/p>\n\n\n\n<p><strong>How buildings are shaped.<\/strong>&nbsp;The bubble chart compares&nbsp;<strong>total space (left-to-right)<\/strong>&nbsp;with&nbsp;<strong>average height in stories (bottom-to-top)<\/strong>.<\/p>\n\n\n\n<ul class=\"wp-block-list\">\n<li><strong>Industrial and Retail<\/strong>\u00a0bubbles sit far to the right but lower on the chart:\u00a0<strong>very large footprints, usually low-rise<\/strong>.<\/li>\n\n\n\n<li><strong>Multi-Family and some Office<\/strong>\u00a0bubbles sit higher:\u00a0<strong>taller buildings<\/strong>\u00a0that stack space vertically.<\/li>\n\n\n\n<li><strong>Health Care and Specialty<\/strong>\u00a0tend to be smaller overall, with height and size varying by subtype.<\/li>\n<\/ul>\n\n\n\n<p><strong>When they were built.<\/strong>&nbsp;The timeline shows the&nbsp;<strong>biggest wave of construction in the 2000s<\/strong>, with strong growth in the&nbsp;<strong>1990s<\/strong>&nbsp;and a&nbsp;<strong>slower 2010s\u20132020s<\/strong>&nbsp;period. That pattern fits what you\u2019d expect post-recession and into the pandemic years. A small \u201cUnknown\u201d bar reflects records without a reliable build year.<\/p>\n\n\n\n<p><strong>What this means at a glance.<\/strong><\/p>\n\n\n\n<ul class=\"wp-block-list\">\n<li>The region\u2019s economy leans heavily on\u00a0<strong>logistics\/industrial space<\/strong>\u00a0and\u00a0<strong>housing (apartments)<\/strong>, with\u00a0<strong>office\/retail<\/strong>\u00a0supporting that base.<\/li>\n\n\n\n<li>The\u00a0<strong>form factor<\/strong>\u00a0is mixed: lots of\u00a0<strong>wide, single- to mid-story<\/strong>\u00a0buildings for industrial and retail, and\u00a0<strong>taller<\/strong>\u00a0structures where people\u00a0<strong>live or work<\/strong>\u00a0(apartments and offices).<\/li>\n\n\n\n<li>The\u00a0<strong>2000s boom<\/strong>\u00a0left a large stock of relatively newer buildings; the most recent decade adds space, but at a slower pace.<\/li>\n<\/ul>\n\n\n\n<p><strong>How to read changes by place or type.<\/strong>&nbsp;Look for counties that darken on the map and check which property types rise in the table for those places. If a county\u2019s bubble for Industrial sits far right on the size-vs-height chart, it\u2019s a logistics-heavy county; if Multi-Family sits higher, it\u2019s adding more vertical residential space.<\/p>\n\n\n\n<p>In short:&nbsp;<strong>a logistics- and housing-led market, built out most strongly in the 1990s\u20132000s, with taller space concentrated in apartments and some offices, and large, low-rise footprints in industrial and retail.<\/strong><\/p>\n\n\n\n<hr class=\"wp-block-separator has-alpha-channel-opacity\"\/>\n\n\n\n<div class='tableauPlaceholder' id='viz1757692770113' style='position: relative'><noscript><a href='#'><img alt='Dashboard 1 ' src='https:&#47;&#47;public.tableau.com&#47;static&#47;images&#47;Co&#47;CommercialRealEstate_17554641618220&#47;Dashboard1&#47;1_rss.png' style='border: none' \/><\/a><\/noscript><object class='tableauViz'  style='display:none;'><param name='host_url' value='https%3A%2F%2Fpublic.tableau.com%2F' \/> <param name='embed_code_version' value='3' \/> <param name='site_root' value='' \/><param name='name' value='CommercialRealEstate_17554641618220&#47;Dashboard1' \/><param name='tabs' value='no' \/><param name='toolbar' value='yes' \/><param name='static_image' value='https:&#47;&#47;public.tableau.com&#47;static&#47;images&#47;Co&#47;CommercialRealEstate_17554641618220&#47;Dashboard1&#47;1.png' \/> <param name='animate_transition' value='yes' \/><param name='display_static_image' value='yes' \/><param name='display_spinner' value='yes' \/><param name='display_overlay' value='yes' \/><param name='display_count' value='yes' \/><param name='language' value='en-US' \/><\/object><\/div>                <script type='text\/javascript'>                    var divElement = document.getElementById('viz1757692770113');                    var vizElement = divElement.getElementsByTagName('object')[0];                    if ( divElement.offsetWidth > 800 ) { vizElement.style.width='100%';vizElement.style.height=(divElement.offsetWidth*0.75)+'px';} else if ( divElement.offsetWidth > 500 ) { vizElement.style.width='100%';vizElement.style.height=(divElement.offsetWidth*0.75)+'px';} else { vizElement.style.width='100%';vizElement.style.height='1727px';}                     var scriptElement = document.createElement('script');                    scriptElement.src = 'https:\/\/public.tableau.com\/javascripts\/api\/viz_v1.js';                    vizElement.parentNode.insertBefore(scriptElement, vizElement);                <\/script>\n","protected":false},"excerpt":{"rendered":"<p>Commercial Real Estate in NCT The dashboard shows a big picture of the region\u2019s built space. Right now it totals about&nbsp;3.26 billion sq ft&nbsp;spread across roughly&nbsp;47,000 buildings, with an&nbsp;average size &#8230;<\/p>\n","protected":false},"author":689,"featured_media":0,"parent":3625,"menu_order":0,"comment_status":"closed","ping_status":"closed","template":"template-fullwidth.php","meta":{"_acf_changed":false,"inline_featured_image":false,"advgb_blocks_editor_width":"","advgb_blocks_columns_visual_guide":"","footnotes":""},"class_list":["post-5727","page","type-page","status-publish","hentry"],"acf":[],"coauthors":[],"author_meta":{"author_link":"https:\/\/www.tarleton.edu\/tieuc\/author\/bkurdle\/","display_name":"Webmaster"},"relative_dates":{"created":"Posted 7 months ago","modified":"Updated 7 months ago"},"absolute_dates":{"created":"Posted on September 12, 2025","modified":"Updated on September 12, 2025"},"absolute_dates_time":{"created":"Posted on September 12, 2025 3:58 pm","modified":"Updated on September 12, 2025 4:00 pm"},"featured_img_caption":"","featured_img":false,"series_order":"","_links":{"self":[{"href":"https:\/\/www.tarleton.edu\/tieuc\/wp-json\/wp\/v2\/pages\/5727","targetHints":{"allow":["GET"]}}],"collection":[{"href":"https:\/\/www.tarleton.edu\/tieuc\/wp-json\/wp\/v2\/pages"}],"about":[{"href":"https:\/\/www.tarleton.edu\/tieuc\/wp-json\/wp\/v2\/types\/page"}],"author":[{"embeddable":true,"href":"https:\/\/www.tarleton.edu\/tieuc\/wp-json\/wp\/v2\/users\/689"}],"replies":[{"embeddable":true,"href":"https:\/\/www.tarleton.edu\/tieuc\/wp-json\/wp\/v2\/comments?post=5727"}],"version-history":[{"count":3,"href":"https:\/\/www.tarleton.edu\/tieuc\/wp-json\/wp\/v2\/pages\/5727\/revisions"}],"predecessor-version":[{"id":5731,"href":"https:\/\/www.tarleton.edu\/tieuc\/wp-json\/wp\/v2\/pages\/5727\/revisions\/5731"}],"up":[{"embeddable":true,"href":"https:\/\/www.tarleton.edu\/tieuc\/wp-json\/wp\/v2\/pages\/3625"}],"wp:attachment":[{"href":"https:\/\/www.tarleton.edu\/tieuc\/wp-json\/wp\/v2\/media?parent=5727"}],"curies":[{"name":"wp","href":"https:\/\/api.w.org\/{rel}","templated":true}]}}