{"id":5625,"date":"2025-07-03T15:32:31","date_gmt":"2025-07-03T15:32:31","guid":{"rendered":"https:\/\/www.tarleton.edu\/tieuc\/?page_id=5625"},"modified":"2025-12-02T01:09:12","modified_gmt":"2025-12-02T01:09:12","slug":"comprehensive-insurance-coverage","status":"publish","type":"page","link":"https:\/\/www.tarleton.edu\/tieuc\/dashboards\/comprehensive-insurance-coverage\/","title":{"rendered":"Comprehensive Insurance Coverage"},"content":{"rendered":"\n<h3 class=\"wp-block-heading\">Comprehensive Insurance Coverage<\/h3>\n\n\n\n<p>This project presents a robust set of&nbsp;<strong>interactive Tableau dashboards<\/strong>&nbsp;analyzing&nbsp;<strong>health insurance coverage<\/strong>&nbsp;characteristics for&nbsp;<strong>12 counties in North Central Texas<\/strong>, with county-level filters and selectable metrics. Together, these dashboards deliver critical insights for&nbsp;<strong>local governments, public health agencies, insurers, employers, and community organizations<\/strong>&nbsp;to identify gaps, design targeted programs, and predict future needs.<\/p>\n\n\n\n<hr class=\"wp-block-separator has-alpha-channel-opacity\"\/>\n\n\n\n<div style=\"height:30px\" aria-hidden=\"true\" class=\"wp-block-spacer\"><\/div>\n\n\n\n<h4 class=\"wp-block-heading\"><strong>Insurance Coverage by Age<\/strong><\/h4>\n\n\n\n<p><strong>What it shows:<\/strong><br>
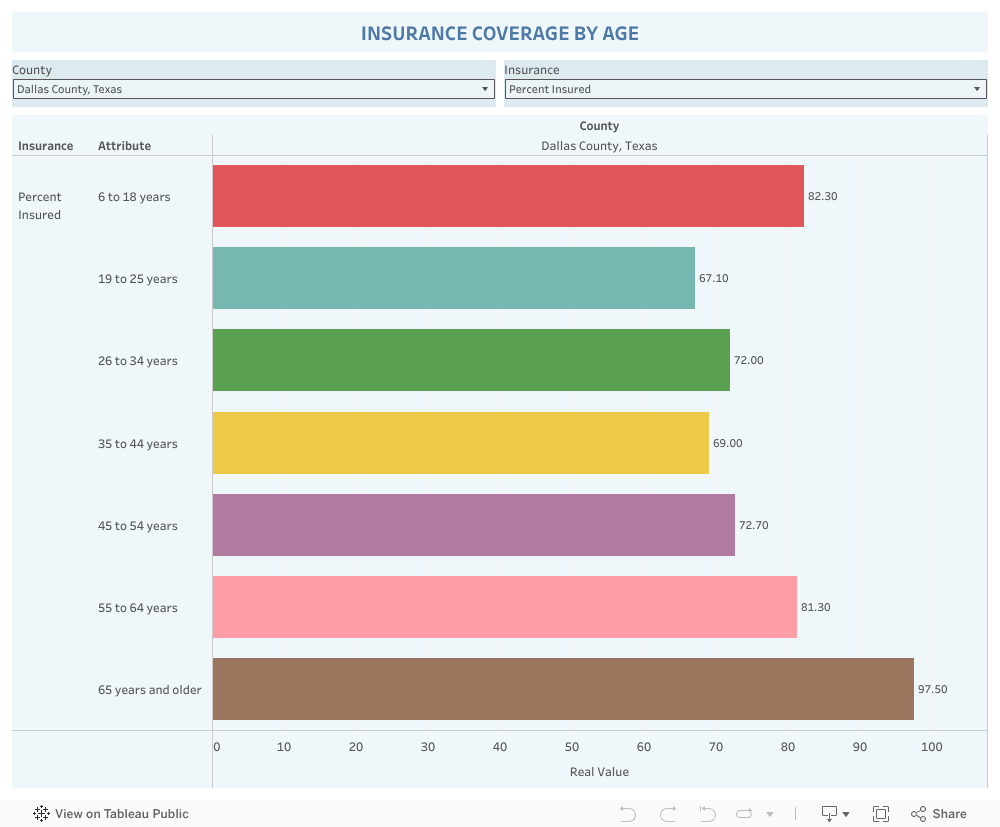
A breakdown of insured (and optionally uninsured) populations by age groups:<\/p>\n\n\n\n<ul class=\"wp-block-list\">\n<li>6 to 18 years<\/li>\n\n\n\n<li>19 to 25 years<\/li>\n\n\n\n<li>26 to 34 years<\/li>\n\n\n\n<li>35 to 44 years<\/li>\n\n\n\n<li>45 to 54 years<\/li>\n\n\n\n<li>55 to 64 years<\/li>\n\n\n\n<li>65 years and older<\/li>\n<\/ul>\n\n\n\n<p><strong>Purpose:<\/strong><br>Visualizes how coverage varies as people age \u2014 highlighting critical groups that may age out of parental or dependent coverage.<\/p>\n\n\n\n<p><strong>Who uses it:<\/strong><br>Public health officials, school districts, student health programs, senior services.<\/p>\n\n\n\n<div class='tableauPlaceholder' id='viz1751557604316' style='position: relative'><noscript><a href='#'><img alt='Dashboard 1 ' src='https:&#47;&#47;public.tableau.com&#47;static&#47;images&#47;7P&#47;7PRZ6W889&#47;1_rss.png' style='border: none' \/><\/a><\/noscript><object class='tableauViz'  style='display:none;'><param name='host_url' value='https%3A%2F%2Fpublic.tableau.com%2F' \/> <param name='embed_code_version' value='3' \/> <param name='path' value='shared&#47;7PRZ6W889' \/> <param name='toolbar' value='yes' \/><param name='static_image' value='https:&#47;&#47;public.tableau.com&#47;static&#47;images&#47;7P&#47;7PRZ6W889&#47;1.png' \/> <param name='animate_transition' value='yes' \/><param name='display_static_image' value='yes' \/><param name='display_spinner' value='yes' \/><param name='display_overlay' value='yes' \/><param name='display_count' value='yes' \/><param name='language' value='en-US' \/><\/object><\/div>                <script type='text\/javascript'>                    var divElement = document.getElementById('viz1751557604316');                    var vizElement = divElement.getElementsByTagName('object')[0];                    if ( divElement.offsetWidth > 800 ) { vizElement.style.width='1000px';vizElement.style.height='827px';} else if ( divElement.offsetWidth > 500 ) { vizElement.style.width='1000px';vizElement.style.height='827px';} else { vizElement.style.width='100%';vizElement.style.height='727px';}                     var scriptElement = document.createElement('script');                    scriptElement.src = 'https:\/\/public.tableau.com\/javascripts\/api\/viz_v1.js';                    vizElement.parentNode.insertBefore(scriptElement, vizElement);                <\/script>\n\n\n\n<hr class=\"wp-block-separator has-alpha-channel-opacity\"\/>\n\n\n\n<div style=\"height:29px\" aria-hidden=\"true\" class=\"wp-block-spacer\"><\/div>\n\n\n\n<h4 class=\"wp-block-heading\"><strong>Insurance Coverage by Ethnicity<\/strong><\/h4>\n\n\n\n<p><strong>What it shows:<\/strong><br>Coverage distribution for diversified racial and ethnic groups:<\/p>\n\n\n\n<ul class=\"wp-block-list\">\n<li>White alone<\/li>\n\n\n\n<li>White alone, not Hispanic or Latino<\/li>\n\n\n\n<li>Hispanic or Latino (of any ethnicity)<\/li>\n\n\n\n<li>Black or African American alone<\/li>\n\n\n\n<li>Asian alone<\/li>\n\n\n\n<li>American Indian and Alaska Native alone<\/li>\n\n\n\n<li>Native Hawaiian and Other Pacific Islander alone<\/li>\n\n\n\n<li>Two or more ethncities<\/li>\n\n\n\n<li>Some other ethnicity alone<\/li>\n<\/ul>\n\n\n\n<p><strong>Purpose:<\/strong><br>Highlights disparities among racial and ethnic groups, supporting targeted fairness initiatives and culturally relevant outreach.<\/p>\n\n\n\n<p><strong>Who uses it:<\/strong><br>Heterogeneity and fairness offices, community organizations, public health policy teams.<\/p>\n\n\n\n<div class='tableauPlaceholder' id='viz1751557948901' style='position: relative'><noscript><a href='#'><img alt='Dashboard 1 ' src='https:&#47;&#47;public.tableau.com&#47;static&#47;images&#47;5M&#47;5MRS3ZYTF&#47;1_rss.png' style='border: none' \/><\/a><\/noscript><object class='tableauViz'  style='display:none;'><param name='host_url' value='https%3A%2F%2Fpublic.tableau.com%2F' \/> <param name='embed_code_version' value='3' \/> <param name='path' value='shared&#47;5MRS3ZYTF' \/> <param name='toolbar' value='yes' \/><param name='static_image' value='https:&#47;&#47;public.tableau.com&#47;static&#47;images&#47;5M&#47;5MRS3ZYTF&#47;1.png' \/> <param name='animate_transition' value='yes' \/><param name='display_static_image' value='yes' \/><param name='display_spinner' value='yes' \/><param name='display_overlay' value='yes' \/><param name='display_count' value='yes' \/><param name='language' value='en-US' \/><\/object><\/div>                <script type='text\/javascript'>                    var divElement = document.getElementById('viz1751557948901');                    var vizElement = divElement.getElementsByTagName('object')[0];                    if ( divElement.offsetWidth > 800 ) { vizElement.style.width='1000px';vizElement.style.height='827px';} else if ( divElement.offsetWidth > 500 ) { vizElement.style.width='1000px';vizElement.style.height='827px';} else { vizElement.style.width='100%';vizElement.style.height='727px';}                     var scriptElement = document.createElement('script');                    scriptElement.src = 'https:\/\/public.tableau.com\/javascripts\/api\/viz_v1.js';                    vizElement.parentNode.insertBefore(scriptElement, vizElement);                <\/script>\n\n\n\n<hr class=\"wp-block-separator has-alpha-channel-opacity\"\/>\n\n\n\n<div style=\"height:31px\" aria-hidden=\"true\" class=\"wp-block-spacer\"><\/div>\n\n\n\n<h4 class=\"wp-block-heading\"><strong>Insurance Coverage by Male or Female<\/strong><\/h4>\n\n\n\n<p><strong>What it shows:<\/strong><br>Comparison of insurance coverage between&nbsp;<strong>males and females<\/strong>.<\/p>\n\n\n\n<p><strong>Purpose:<\/strong><br>Detects potential coverage gaps based on male or female that could reflect workforce participation differences, employer benefit disparities, or barriers to enrollment.<\/p>\n\n\n\n<p><strong>Who uses it:<\/strong><br>HR teams, women\u2019s health advocates, benefits administrators.<\/p>\n\n\n\n<div class='tableauPlaceholder' id='viz1764637712287' style='position: relative'><noscript><a href='#'><img alt='Dashboard 1 ' src='https:&#47;&#47;public.tableau.com&#47;static&#47;images&#47;Se&#47;SelectedCharacteristicsofHealthInsuranceCoveragein2022BySex&#47;Dashboard1&#47;1_rss.png' style='border: none' \/><\/a><\/noscript><object class='tableauViz'  style='display:none;'><param name='host_url' value='https%3A%2F%2Fpublic.tableau.com%2F' \/> <param name='embed_code_version' value='3' \/> <param name='site_root' value='' \/><param name='name' value='SelectedCharacteristicsofHealthInsuranceCoveragein2022BySex&#47;Dashboard1' \/><param name='tabs' value='no' \/><param name='toolbar' value='yes' \/><param name='static_image' value='https:&#47;&#47;public.tableau.com&#47;static&#47;images&#47;Se&#47;SelectedCharacteristicsofHealthInsuranceCoveragein2022BySex&#47;Dashboard1&#47;1.png' \/> <param name='animate_transition' value='yes' \/><param name='display_static_image' value='yes' \/><param name='display_spinner' value='yes' \/><param name='display_overlay' value='yes' \/><param name='display_count' value='yes' \/><param name='language' value='en-US' \/><\/object><\/div>                <script type='text\/javascript'>                    var divElement = document.getElementById('viz1764637712287');                    var vizElement = divElement.getElementsByTagName('object')[0];                    if ( divElement.offsetWidth > 800 ) { vizElement.style.width='1000px';vizElement.style.height='827px';} else if ( divElement.offsetWidth > 500 ) { vizElement.style.width='1000px';vizElement.style.height='827px';} else { vizElement.style.width='100%';vizElement.style.height='727px';}                     var scriptElement = document.createElement('script');                    scriptElement.src = 'https:\/\/public.tableau.com\/javascripts\/api\/viz_v1.js';                    vizElement.parentNode.insertBefore(scriptElement, vizElement);                <\/script>\n\n\n\n<hr class=\"wp-block-separator has-alpha-channel-opacity\"\/>\n\n\n\n<div style=\"height:29px\" aria-hidden=\"true\" class=\"wp-block-spacer\"><\/div>\n\n\n\n<h4 class=\"wp-block-heading\"><strong>Insurance Coverage by Poverty Status &amp; Economic Status<\/strong><\/h4>\n\n\n\n<p><strong>What it shows:<\/strong><br>Coverage by income brackets relative to the federal poverty threshold:<\/p>\n\n\n\n<ul class=\"wp-block-list\">\n<li>Below 100%<\/li>\n\n\n\n<li>Below 138%<\/li>\n\n\n\n<li>138%\u2013399%<\/li>\n\n\n\n<li>400% and above<\/li>\n<\/ul>\n\n\n\n<p><strong>Purpose:<\/strong><br>Identifies how income levels correlate with access to insurance, which is vital for targeting Medicaid expansion, subsidies, or charity care.<\/p>\n\n\n\n<p><strong>Who uses it:<\/strong><br>Policy analysts, social services, Medicaid administrators.<\/p>\n\n\n\n<div class='tableauPlaceholder' id='viz1751558271616' style='position: relative'><noscript><a href='#'><img alt='Dashboard 1 ' src='https:&#47;&#47;public.tableau.com&#47;static&#47;images&#47;PZ&#47;PZX48BJWH&#47;1_rss.png' style='border: none' \/><\/a><\/noscript><object class='tableauViz'  style='display:none;'><param name='host_url' value='https%3A%2F%2Fpublic.tableau.com%2F' \/> <param name='embed_code_version' value='3' \/> <param name='path' value='shared&#47;PZX48BJWH' \/> <param name='toolbar' value='yes' \/><param name='static_image' value='https:&#47;&#47;public.tableau.com&#47;static&#47;images&#47;PZ&#47;PZX48BJWH&#47;1.png' \/> <param name='animate_transition' value='yes' \/><param name='display_static_image' value='yes' \/><param name='display_spinner' value='yes' \/><param name='display_overlay' value='yes' \/><param name='display_count' value='yes' \/><param name='language' value='en-US' \/><\/object><\/div>                <script type='text\/javascript'>                    var divElement = document.getElementById('viz1751558271616');                    var vizElement = divElement.getElementsByTagName('object')[0];                    if ( divElement.offsetWidth > 800 ) { vizElement.style.width='1000px';vizElement.style.height='827px';} else if ( divElement.offsetWidth > 500 ) { vizElement.style.width='1000px';vizElement.style.height='827px';} else { vizElement.style.width='100%';vizElement.style.height='727px';}                     var scriptElement = document.createElement('script');                    scriptElement.src = 'https:\/\/public.tableau.com\/javascripts\/api\/viz_v1.js';                    vizElement.parentNode.insertBefore(scriptElement, vizElement);                <\/script>\n\n\n\n<hr class=\"wp-block-separator has-alpha-channel-opacity\"\/>\n\n\n\n<div style=\"height:30px\" aria-hidden=\"true\" class=\"wp-block-spacer\"><\/div>\n\n\n\n<h4 class=\"wp-block-heading\"><strong>Insurance Coverage by Employment and Education Level<\/strong><\/h4>\n\n\n\n<p><strong>What it shows:<\/strong><br><strong>Education:<\/strong><\/p>\n\n\n\n<ul class=\"wp-block-list\">\n<li>Less than high school graduate<\/li>\n\n\n\n<li>High school graduate (includes equivalency)<\/li>\n\n\n\n<li>Bachelor\u2019s degree or higher<\/li>\n<\/ul>\n\n\n\n<p><strong>Employment:<\/strong><\/p>\n\n\n\n<ul class=\"wp-block-list\">\n<li>Employed<\/li>\n\n\n\n<li>In labor force<\/li>\n\n\n\n<li>Unemployed<\/li>\n<\/ul>\n\n\n\n<p><strong>Purpose:<\/strong><br>Reveals how education and employment status influence insurance coverage, helping with workforce development plans and adult education outreach.<\/p>\n\n\n\n<p><strong>Who uses it:<\/strong><br>Workforce boards, community colleges, economic development offices.<\/p>\n\n\n\n<div class='tableauPlaceholder' id='viz1751558358560' style='position: relative'><noscript><a href='#'><img alt='Dashboard 1 ' src='https:&#47;&#47;public.tableau.com&#47;static&#47;images&#47;8C&#47;8C6MF28Y3&#47;1_rss.png' style='border: none' \/><\/a><\/noscript><object class='tableauViz'  style='display:none;'><param name='host_url' value='https%3A%2F%2Fpublic.tableau.com%2F' \/> <param name='embed_code_version' value='3' \/> <param name='path' value='shared&#47;8C6MF28Y3' \/> <param name='toolbar' value='yes' \/><param name='static_image' value='https:&#47;&#47;public.tableau.com&#47;static&#47;images&#47;8C&#47;8C6MF28Y3&#47;1.png' \/> <param name='animate_transition' value='yes' \/><param name='display_static_image' value='yes' \/><param name='display_spinner' value='yes' \/><param name='display_overlay' value='yes' \/><param name='display_count' value='yes' \/><param name='language' value='en-US' \/><\/object><\/div>                <script type='text\/javascript'>                    var divElement = document.getElementById('viz1751558358560');                    var vizElement = divElement.getElementsByTagName('object')[0];                    if ( divElement.offsetWidth > 800 ) { vizElement.style.width='1000px';vizElement.style.height='827px';} else if ( divElement.offsetWidth > 500 ) { vizElement.style.width='1000px';vizElement.style.height='827px';} else { vizElement.style.width='100%';vizElement.style.height='827px';}                     var scriptElement = document.createElement('script');                    scriptElement.src = 'https:\/\/public.tableau.com\/javascripts\/api\/viz_v1.js';                    vizElement.parentNode.insertBefore(scriptElement, vizElement);                <\/script>\n\n\n\n<hr class=\"wp-block-separator has-alpha-channel-opacity\"\/>\n\n\n\n<div style=\"height:29px\" aria-hidden=\"true\" class=\"wp-block-spacer\"><\/div>\n\n\n\n<h4 class=\"wp-block-heading\"><strong>Insurance Coverage by Disability Status<\/strong><\/h4>\n\n\n\n<p><strong>What it shows:<\/strong><br>Comparison of coverage among those&nbsp;<strong>with<\/strong>&nbsp;or&nbsp;<strong>without a disability<\/strong>.<\/p>\n\n\n\n<p><strong>Purpose:<\/strong><br>Brings attention to possible barriers for disabled residents, supporting accessible benefits programs and special assistance outreach.<\/p>\n\n\n\n<p><strong>Who uses it:<\/strong><br>Social services, disability advocates, local governments.<\/p>\n\n\n\n<div class='tableauPlaceholder' id='viz1751558389379' style='position: relative'><noscript><a href='#'><img alt='Dashboard 1 ' src='https:&#47;&#47;public.tableau.com&#47;static&#47;images&#47;IN&#47;INSURANCECOVERGEBYDisability&#47;Dashboard1&#47;1_rss.png' style='border: none' \/><\/a><\/noscript><object class='tableauViz'  style='display:none;'><param name='host_url' value='https%3A%2F%2Fpublic.tableau.com%2F' \/> <param name='embed_code_version' value='3' \/> <param name='site_root' value='' \/><param name='name' value='INSURANCECOVERGEBYDisability&#47;Dashboard1' \/><param name='tabs' value='no' \/><param name='toolbar' value='yes' \/><param name='static_image' value='https:&#47;&#47;public.tableau.com&#47;static&#47;images&#47;IN&#47;INSURANCECOVERGEBYDisability&#47;Dashboard1&#47;1.png' \/> <param name='animate_transition' value='yes' \/><param name='display_static_image' value='yes' \/><param name='display_spinner' value='yes' \/><param name='display_overlay' value='yes' \/><param name='display_count' value='yes' \/><param name='language' value='en-US' \/><\/object><\/div>                <script type='text\/javascript'>                    var divElement = document.getElementById('viz1751558389379');                    var vizElement = divElement.getElementsByTagName('object')[0];                    if ( divElement.offsetWidth > 800 ) { vizElement.style.width='1000px';vizElement.style.height='827px';} else if ( divElement.offsetWidth > 500 ) { vizElement.style.width='1000px';vizElement.style.height='827px';} else { vizElement.style.width='100%';vizElement.style.height='727px';}                     var scriptElement = document.createElement('script');                    scriptElement.src = 'https:\/\/public.tableau.com\/javascripts\/api\/viz_v1.js';                    vizElement.parentNode.insertBefore(scriptElement, vizElement);                <\/script>\n\n\n\n<hr class=\"wp-block-separator has-alpha-channel-opacity\"\/>\n\n\n\n<div style=\"height:30px\" aria-hidden=\"true\" class=\"wp-block-spacer\"><\/div>\n\n\n\n<h4 class=\"wp-block-heading\"><strong>Insurance Coverage by Nativity<\/strong><\/h4>\n\n\n\n<p><strong>What it shows:<\/strong><br>Breakdown by nativity:<\/p>\n\n\n\n<ul class=\"wp-block-list\">\n<li>Native born<\/li>\n\n\n\n<li>Foreign born<\/li>\n\n\n\n<li>Naturalized citizens<\/li>\n\n\n\n<li>Not citizens<\/li>\n<\/ul>\n\n\n\n<p><strong>Purpose:<\/strong><br>Shows how insurance coverage levels differ for immigrants and non-citizens, a key factor for local immigrant resource groups and policy design.<\/p>\n\n\n\n<p><strong>Who uses it:<\/strong><br>Immigrant community organizations, local policymakers, non-profits.<\/p>\n\n\n\n<div class='tableauPlaceholder' id='viz1751558421592' style='position: relative'><noscript><a href='#'><img alt='Dashboard 1 ' src='https:&#47;&#47;public.tableau.com&#47;static&#47;images&#47;IN&#47;INSURANCECOVERGEBYNativity&#47;Dashboard1&#47;1_rss.png' style='border: none' \/><\/a><\/noscript><object class='tableauViz'  style='display:none;'><param name='host_url' value='https%3A%2F%2Fpublic.tableau.com%2F' \/> <param name='embed_code_version' value='3' \/> <param name='site_root' value='' \/><param name='name' value='INSURANCECOVERGEBYNativity&#47;Dashboard1' \/><param name='tabs' value='no' \/><param name='toolbar' value='yes' \/><param name='static_image' value='https:&#47;&#47;public.tableau.com&#47;static&#47;images&#47;IN&#47;INSURANCECOVERGEBYNativity&#47;Dashboard1&#47;1.png' \/> <param name='animate_transition' value='yes' \/><param name='display_static_image' value='yes' \/><param name='display_spinner' value='yes' \/><param name='display_overlay' value='yes' \/><param name='display_count' value='yes' \/><param name='language' value='en-US' \/><\/object><\/div>                <script type='text\/javascript'>                    var divElement = document.getElementById('viz1751558421592');                    var vizElement = divElement.getElementsByTagName('object')[0];                    if ( divElement.offsetWidth > 800 ) { vizElement.style.width='1000px';vizElement.style.height='827px';} else if ( divElement.offsetWidth > 500 ) { vizElement.style.width='1000px';vizElement.style.height='827px';} else { vizElement.style.width='100%';vizElement.style.height='727px';}                     var scriptElement = document.createElement('script');                    scriptElement.src = 'https:\/\/public.tableau.com\/javascripts\/api\/viz_v1.js';                    vizElement.parentNode.insertBefore(scriptElement, vizElement);                <\/script>\n\n\n\n<hr class=\"wp-block-separator has-alpha-channel-opacity\"\/>\n\n\n\n<div style=\"height:31px\" aria-hidden=\"true\" class=\"wp-block-spacer\"><\/div>\n\n\n\n<h4 class=\"wp-block-heading\"><strong>Insurance Coverage by Household<\/strong><\/h4>\n\n\n\n<p><strong>What it shows:<\/strong><br>Coverage by household type:<\/p>\n\n\n\n<ul class=\"wp-block-list\">\n<li>In married couple families<\/li>\n\n\n\n<li>In family households<\/li>\n\n\n\n<li>In non-family households and other living arrangements<\/li>\n\n\n\n<li>In other families<\/li>\n\n\n\n<li>Female reference person, no spouse present<\/li>\n\n\n\n<li>Male reference person, no spouse present<\/li>\n<\/ul>\n\n\n\n<p><strong>Purpose:<\/strong><br>Reveals how living arrangements affect insurance rates \u2014 critical for social planners, family services, and affordable housing advocates.<\/p>\n\n\n\n<p><strong>Who uses it:<\/strong><br>Social policy analysts, family resource centers, housing authorities.<\/p>\n\n\n\n<div class='tableauPlaceholder' id='viz1751558456451' style='position: relative'><noscript><a href='#'><img alt='Dashboard 1 ' src='https:&#47;&#47;public.tableau.com&#47;static&#47;images&#47;CZ&#47;CZ37XWC33&#47;1_rss.png' style='border: none' \/><\/a><\/noscript><object class='tableauViz'  style='display:none;'><param name='host_url' value='https%3A%2F%2Fpublic.tableau.com%2F' \/> <param name='embed_code_version' value='3' \/> <param name='path' value='shared&#47;CZ37XWC33' \/> <param name='toolbar' value='yes' \/><param name='static_image' value='https:&#47;&#47;public.tableau.com&#47;static&#47;images&#47;CZ&#47;CZ37XWC33&#47;1.png' \/> <param name='animate_transition' value='yes' \/><param name='display_static_image' value='yes' \/><param name='display_spinner' value='yes' \/><param name='display_overlay' value='yes' \/><param name='display_count' value='yes' \/><param name='language' value='en-US' \/><\/object><\/div>                <script type='text\/javascript'>                    var divElement = document.getElementById('viz1751558456451');                    var vizElement = divElement.getElementsByTagName('object')[0];                    if ( divElement.offsetWidth > 800 ) { vizElement.style.width='1000px';vizElement.style.height='827px';} else if ( divElement.offsetWidth > 500 ) { vizElement.style.width='1000px';vizElement.style.height='827px';} else { vizElement.style.width='100%';vizElement.style.height='727px';}                     var scriptElement = document.createElement('script');                    scriptElement.src = 'https:\/\/public.tableau.com\/javascripts\/api\/viz_v1.js';                    vizElement.parentNode.insertBefore(scriptElement, vizElement);                <\/script>\n\n\n\n<hr class=\"wp-block-separator has-alpha-channel-opacity\"\/>\n\n\n\n<p><strong>&nbsp;Counties Covered<\/strong><\/p>\n\n\n\n<p>Your dashboards provide selectable data for:<\/p>\n\n\n\n<ul class=\"wp-block-list\">\n<li>Collin County, Texas<\/li>\n\n\n\n<li>Dallas County, Texas<\/li>\n\n\n\n<li>Denton County, Texas<\/li>\n\n\n\n<li>Tarrant County, Texas<\/li>\n\n\n\n<li>Johnson County, Texas<\/li>\n\n\n\n<li>Ellis County, Texas<\/li>\n\n\n\n<li>Hood County, Texas<\/li>\n\n\n\n<li>Hunt County, Texas<\/li>\n\n\n\n<li>Parker County, Texas<\/li>\n\n\n\n<li>Rockwall County, Texas<\/li>\n\n\n\n<li>Wise County, Texas<\/li>\n\n\n\n<li>Kaufman County, Texas<\/li>\n<\/ul>\n\n\n\n<hr class=\"wp-block-separator has-alpha-channel-opacity\"\/>\n\n\n\n<p><strong>&nbsp;Combined Value<\/strong><\/p>\n\n\n\n<p>Together, these dashboards form a&nbsp;<strong>powerful toolkit<\/strong>&nbsp;to:<\/p>\n\n\n\n<ul class=\"wp-block-list\">\n<li>Pinpoint who is underinsured or uninsured by demographic, household, or economic factors.<\/li>\n\n\n\n<li>Predict which groups may need expanded services, outreach, or subsidies.<\/li>\n\n\n\n<li>Support grant applications and local funding by providing clear, credible data.<\/li>\n\n\n\n<li>Equip policymakers and health providers to close gaps in a&nbsp;<strong>data-driven, fair way<\/strong>.<\/li>\n<\/ul>\n\n\n\n<hr class=\"wp-block-separator has-alpha-channel-opacity\"\/>\n\n\n\n<p><strong>&nbsp;Actionable Recommendations<\/strong><\/p>\n\n\n\n<p><img decoding=\"async\" src=\"https:\/\/fonts.gstatic.com\/s\/e\/notoemoji\/16.0\/2714_fe0f\/72.png\" alt=\"Decorative check mark for advantages\" style=\"\">&nbsp;<strong>1. Publish &amp; Share:<\/strong><br>Embed the dashboards in public-facing sites for local governments, schools, health agencies, or non-profits.<\/p>\n\n\n\n<p><img decoding=\"async\" src=\"https:\/\/fonts.gstatic.com\/s\/e\/notoemoji\/16.0\/2714_fe0f\/72.png\" alt=\"Decorative check mark for advantages\" style=\"\">&nbsp;<strong>2. Use for Grant Writing:<\/strong><br>Incorporate the visuals and metrics into funding proposals for community health grants or local outreach programs.<\/p>\n\n\n\n<p><img decoding=\"async\" style=\"\" src=\"https:\/\/fonts.gstatic.com\/s\/e\/notoemoji\/16.0\/2714_fe0f\/72.png\" alt=\"Decorative check mark for advantages\">&nbsp;<strong>3. Drive Community Outreach:<\/strong><br>Use ethnicity, nativity, and poverty breakdowns to design culturally appropriate, language-accessible campaigns.<\/p>\n\n\n\n<p><img decoding=\"async\" src=\"https:\/\/fonts.gstatic.com\/s\/e\/notoemoji\/16.0\/2714_fe0f\/72.png\" alt=\"Decorative check mark for advantages\" style=\"\">&nbsp;<strong>4. Train Local Teams:<\/strong><br>Provide short trainings to local decision-makers so they can run custom filters by county and attribute to answer their own questions.<\/p>\n\n\n\n<p><img decoding=\"async\" src=\"https:\/\/fonts.gstatic.com\/s\/e\/notoemoji\/16.0\/2714_fe0f\/72.png\" alt=\"Decorative check mark for advantages\" style=\"\">&nbsp;<strong>5. Refresh Data Annually:<\/strong><br>Update the dashboards with the latest census and insurance data to keep trends current and maintain credibility.<\/p>\n\n\n\n<p><img decoding=\"async\" src=\"https:\/\/fonts.gstatic.com\/s\/e\/notoemoji\/16.0\/2714_fe0f\/72.png\" alt=\"Decorative check mark for advantages\" style=\"\">&nbsp;<strong>6. Report Outcomes:<\/strong><br>Track changes over time to see how outreach or policy changes impact coverage levels \u2014 use this for accountability reporting.<\/p>\n","protected":false},"excerpt":{"rendered":"<p>Comprehensive Insurance Coverage This project presents a robust set of&nbsp;interactive Tableau dashboards&nbsp;analyzing&nbsp;health insurance coverage&nbsp;characteristics for&nbsp;12 counties in North Central Texas, with county-level filters and selectable metrics. Together, these dashboards deliver &#8230;<\/p>\n","protected":false},"author":689,"featured_media":0,"parent":3625,"menu_order":0,"comment_status":"closed","ping_status":"closed","template":"template-fullwidth.php","meta":{"_acf_changed":false,"inline_featured_image":false,"advgb_blocks_editor_width":"","advgb_blocks_columns_visual_guide":"","footnotes":""},"class_list":["post-5625","page","type-page","status-publish","hentry"],"acf":[],"coauthors":[],"author_meta":{"author_link":"https:\/\/www.tarleton.edu\/tieuc\/author\/bkurdle\/","display_name":"Webmaster"},"relative_dates":{"created":"Posted 10 months ago","modified":"Updated 5 months ago"},"absolute_dates":{"created":"Posted on July 3, 2025","modified":"Updated on December 2, 2025"},"absolute_dates_time":{"created":"Posted on July 3, 2025 3:32 pm","modified":"Updated on December 2, 2025 1:09 am"},"featured_img_caption":"","featured_img":false,"series_order":"","_links":{"self":[{"href":"https:\/\/www.tarleton.edu\/tieuc\/wp-json\/wp\/v2\/pages\/5625","targetHints":{"allow":["GET"]}}],"collection":[{"href":"https:\/\/www.tarleton.edu\/tieuc\/wp-json\/wp\/v2\/pages"}],"about":[{"href":"https:\/\/www.tarleton.edu\/tieuc\/wp-json\/wp\/v2\/types\/page"}],"author":[{"embeddable":true,"href":"https:\/\/www.tarleton.edu\/tieuc\/wp-json\/wp\/v2\/users\/689"}],"replies":[{"embeddable":true,"href":"https:\/\/www.tarleton.edu\/tieuc\/wp-json\/wp\/v2\/comments?post=5625"}],"version-history":[{"count":13,"href":"https:\/\/www.tarleton.edu\/tieuc\/wp-json\/wp\/v2\/pages\/5625\/revisions"}],"predecessor-version":[{"id":5811,"href":"https:\/\/www.tarleton.edu\/tieuc\/wp-json\/wp\/v2\/pages\/5625\/revisions\/5811"}],"up":[{"embeddable":true,"href":"https:\/\/www.tarleton.edu\/tieuc\/wp-json\/wp\/v2\/pages\/3625"}],"wp:attachment":[{"href":"https:\/\/www.tarleton.edu\/tieuc\/wp-json\/wp\/v2\/media?parent=5625"}],"curies":[{"name":"wp","href":"https:\/\/api.w.org\/{rel}","templated":true}]}}