{"id":5581,"date":"2025-06-05T15:24:03","date_gmt":"2025-06-05T15:24:03","guid":{"rendered":"https:\/\/www.tarleton.edu\/tieuc\/?page_id=5581"},"modified":"2025-06-05T15:26:26","modified_gmt":"2025-06-05T15:26:26","slug":"narcotics-and-prescription-trends-in-nct","status":"publish","type":"page","link":"https:\/\/www.tarleton.edu\/tieuc\/dashboards\/narcotics-and-prescription-trends-in-nct\/","title":{"rendered":"Narcotics and Prescription Trends in NCT"},"content":{"rendered":"\n<h3 class=\"wp-block-heading\">Narcotics Usage and Prescription Trends in NCT<\/h3>\n\n\n\n<p>This interactive dashboard provides a multi-faceted view of narcotics-related prescription and usage patterns across&nbsp;<strong>24 counties in Texas<\/strong>&nbsp;from&nbsp;<strong>2014 to 2022<\/strong>. It is designed to help public health professionals, policymakers, and stakeholders identify areas with significant opioid activity and track annual trends in controlled substance distribution and impact.<\/p>\n\n\n\n<hr class=\"wp-block-separator has-alpha-channel-opacity\"\/>\n\n\n\n<p><strong>&nbsp;
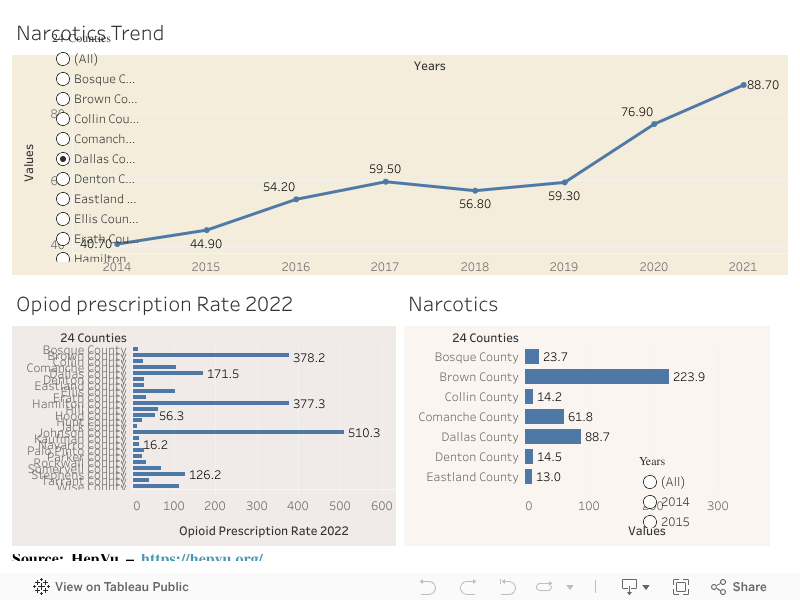
Top Panel: Narcotics Trend (2014\u20132021)<\/strong><\/p>\n\n\n\n<ul class=\"wp-block-list\">\n<li>This&nbsp;<strong>line chart<\/strong>&nbsp;shows the&nbsp;<strong>year-over-year average narcotics values<\/strong>&nbsp;(e.g., rates, dosage distribution, or similar metrics) across the selected counties.<\/li>\n\n\n\n<li>The values have risen&nbsp;<strong>consistently<\/strong>&nbsp;from&nbsp;<strong>11.5 in 2014<\/strong>&nbsp;to a peak of&nbsp;<strong>25.2 in 2021<\/strong>.<\/li>\n\n\n\n<li>Notable increases:\n<ul class=\"wp-block-list\">\n<li>Sharp rise from&nbsp;<strong>16.9 (2019)<\/strong>&nbsp;to&nbsp;<strong>21.8 (2020)<\/strong>, suggesting a potential spike during the pandemic.<\/li>\n\n\n\n<li>Consistent growth trend may indicate a growing opioid issue in the region.<\/li>\n<\/ul>\n<\/li>\n\n\n\n<li>County selector (left) allows users to drill down into individual counties to view their specific trendline.<\/li>\n<\/ul>\n\n\n\n<hr class=\"wp-block-separator has-alpha-channel-opacity\"\/>\n\n\n\n<p><strong>&nbsp;Bottom Left: Opioid Prescription Rate (2022)<\/strong><\/p>\n\n\n\n<ul class=\"wp-block-list\">\n<li>A&nbsp;<strong>horizontal bar chart<\/strong>&nbsp;ranks all 24 counties based on their&nbsp;<strong>prescription rate in 2022<\/strong>.<\/li>\n\n\n\n<li><strong>Johnson County<\/strong>&nbsp;leads with a staggering rate of&nbsp;<strong>510.3<\/strong>, followed by&nbsp;<strong>Brown County (378.2)<\/strong>&nbsp;and&nbsp;<strong>Hamilton County (377.3)<\/strong>.<\/li>\n\n\n\n<li>Other counties with rates above 100 include:\n<ul class=\"wp-block-list\">\n<li><strong>Collin, Comanche, Dallas, Erath, Ellis, Hill, and Wise<\/strong><\/li>\n<\/ul>\n<\/li>\n\n\n\n<li>This panel is useful for:\n<ul class=\"wp-block-list\">\n<li>Identifying&nbsp;<strong>prescribing hotspots<\/strong><\/li>\n\n\n\n<li>Pinpointing counties that may need&nbsp;<strong>intervention or review of prescribing practices<\/strong><\/li>\n<\/ul>\n<\/li>\n<\/ul>\n\n\n\n<hr class=\"wp-block-separator has-alpha-channel-opacity\"\/>\n\n\n\n<p><strong>&nbsp;Bottom Right: Narcotics Distribution by County and Year<\/strong><\/p>\n\n\n\n<ul class=\"wp-block-list\">\n<li>Another&nbsp;<strong>bar chart with year filter<\/strong>&nbsp;that allows users to assess changes in narcotics values per county over time.<\/li>\n\n\n\n<li>Default shows a comparison across counties for the selected year:\n<ul class=\"wp-block-list\">\n<li>In the sample year (likely 2021),&nbsp;<strong>Johnson County (202.8)<\/strong>&nbsp;and&nbsp;<strong>Hamilton County (154.7)<\/strong>&nbsp;again appear among the highest.<\/li>\n\n\n\n<li>This reinforces trends from the prescription chart, suggesting these counties have persistent high narcotics activity.<\/li>\n<\/ul>\n<\/li>\n\n\n\n<li>Slider on the right lets users compare&nbsp;<strong>values from 2015 through 2021<\/strong>&nbsp;to monitor historical changes.<\/li>\n<\/ul>\n\n\n\n<hr class=\"wp-block-separator has-alpha-channel-opacity\"\/>\n\n\n\n<p><strong>&nbsp;Key Insights<\/strong><\/p>\n\n\n\n<ul class=\"wp-block-list\">\n<li><img decoding=\"async\" src=\"https:\/\/fonts.gstatic.com\/s\/e\/notoemoji\/16.0\/1f4c8\/72.png\" alt=\"Upward trend in narcotics values suggests a continued increase in opioid-related activity in many counties\" style=\"\">&nbsp;<strong>Upward trend<\/strong>&nbsp;in narcotics values suggests a continued increase in opioid-related activity in many counties.<\/li>\n\n\n\n<li><img decoding=\"async\" src=\"https:\/\/fonts.gstatic.com\/s\/e\/notoemoji\/16.0\/26a0_fe0f\/72.png\" alt=\"\u26a0\ufe0fCertain counties (Johnson, Hamilton, Brown) show consistently high prescription rates and narcotics usage\" style=\"\">&nbsp;<strong>Certain counties<\/strong>&nbsp;(Johnson, Hamilton, Brown) show&nbsp;<strong>consistently high prescription rates and narcotics values<\/strong>, making them potential focus areas for health policy interventions.<\/li>\n\n\n\n<li><img decoding=\"async\" src=\"https:\/\/fonts.gstatic.com\/s\/e\/notoemoji\/16.0\/1f4ca\/72.png\" alt=\"\ud83d\udccaThe dashboard provides a dynamic interface to explore trends temporally and geographically\" style=\"\">&nbsp;The dashboard provides a&nbsp;<strong>dynamic interface<\/strong>&nbsp;to explore trends both temporally (by year) and geographically (by county), enabling targeted analysis.<\/li>\n<\/ul>\n\n\n\n<hr class=\"wp-block-separator has-alpha-channel-opacity\"\/>\n\n\n\n<p><strong>&nbsp;Recommendations<\/strong><\/p>\n\n\n\n<ul class=\"wp-block-list\">\n<li>Further investigate counties with highest year-over-year increases.<\/li>\n\n\n\n<li>Consider correlating this data with&nbsp;<strong>overdose rates<\/strong>,&nbsp;<strong>treatment availability<\/strong>, and&nbsp;<strong>prescription practices<\/strong>.<\/li>\n\n\n\n<li>Use this dashboard for&nbsp;<strong>resource planning<\/strong>,&nbsp;<strong>public health outreach<\/strong>, and&nbsp;<strong>opioid harm reduction strategies<\/strong>.<\/li>\n<\/ul>\n\n\n\n<hr class=\"wp-block-separator has-alpha-channel-opacity\"\/>\n\n\n\n<div class='tableauPlaceholder' id='viz1749136785157' style='position: relative'><noscript><a href='#'><img alt='Dashboard 1 ' src='https:&#47;&#47;public.tableau.com&#47;static&#47;images&#47;Na&#47;NarcoOpiodprescriptionrate&#47;Dashboard1&#47;1_rss.png' style='border: none' \/><\/a><\/noscript><object class='tableauViz'  style='display:none;'><param name='host_url' value='https%3A%2F%2Fpublic.tableau.com%2F' \/> <param name='embed_code_version' value='3' \/> <param name='site_root' value='' \/><param name='name' value='NarcoOpiodprescriptionrate&#47;Dashboard1' \/><param name='tabs' value='no' \/><param name='toolbar' value='yes' \/><param name='static_image' value='https:&#47;&#47;public.tableau.com&#47;static&#47;images&#47;Na&#47;NarcoOpiodprescriptionrate&#47;Dashboard1&#47;1.png' \/> <param name='animate_transition' value='yes' \/><param name='display_static_image' value='yes' \/><param name='display_spinner' value='yes' \/><param name='display_overlay' value='yes' \/><param name='display_count' value='yes' \/><param name='language' value='en-US' \/><\/object><\/div>                <script type='text\/javascript'>                    var divElement = document.getElementById('viz1749136785157');                    var vizElement = divElement.getElementsByTagName('object')[0];                    if ( divElement.offsetWidth > 800 ) { vizElement.style.width='100%';vizElement.style.height=(divElement.offsetWidth*0.75)+'px';} else if ( divElement.offsetWidth > 500 ) { vizElement.style.width='100%';vizElement.style.height=(divElement.offsetWidth*0.75)+'px';} else { vizElement.style.width='100%';vizElement.style.height='1077px';}                     var scriptElement = document.createElement('script');                    scriptElement.src = 'https:\/\/public.tableau.com\/javascripts\/api\/viz_v1.js';                    vizElement.parentNode.insertBefore(scriptElement, vizElement);                <\/script>\n","protected":false},"excerpt":{"rendered":"<p>Narcotics Usage and Prescription Trends in NCT This interactive dashboard provides a multi-faceted view of narcotics-related prescription and usage patterns across&nbsp;24 counties in Texas&nbsp;from&nbsp;2014 to 2022. It is designed to &#8230;<\/p>\n","protected":false},"author":689,"featured_media":0,"parent":3625,"menu_order":0,"comment_status":"closed","ping_status":"closed","template":"template-fullwidth.php","meta":{"_acf_changed":false,"inline_featured_image":false,"advgb_blocks_editor_width":"","advgb_blocks_columns_visual_guide":"","footnotes":""},"class_list":["post-5581","page","type-page","status-publish","hentry"],"acf":[],"coauthors":[],"author_meta":{"author_link":"https:\/\/www.tarleton.edu\/tieuc\/author\/bkurdle\/","display_name":"Webmaster"},"relative_dates":{"created":"Posted 10 months ago","modified":"Updated 10 months ago"},"absolute_dates":{"created":"Posted on June 5, 2025","modified":"Updated on June 5, 2025"},"absolute_dates_time":{"created":"Posted on June 5, 2025 3:24 pm","modified":"Updated on June 5, 2025 3:26 pm"},"featured_img_caption":"","featured_img":false,"series_order":"","_links":{"self":[{"href":"https:\/\/www.tarleton.edu\/tieuc\/wp-json\/wp\/v2\/pages\/5581","targetHints":{"allow":["GET"]}}],"collection":[{"href":"https:\/\/www.tarleton.edu\/tieuc\/wp-json\/wp\/v2\/pages"}],"about":[{"href":"https:\/\/www.tarleton.edu\/tieuc\/wp-json\/wp\/v2\/types\/page"}],"author":[{"embeddable":true,"href":"https:\/\/www.tarleton.edu\/tieuc\/wp-json\/wp\/v2\/users\/689"}],"replies":[{"embeddable":true,"href":"https:\/\/www.tarleton.edu\/tieuc\/wp-json\/wp\/v2\/comments?post=5581"}],"version-history":[{"count":3,"href":"https:\/\/www.tarleton.edu\/tieuc\/wp-json\/wp\/v2\/pages\/5581\/revisions"}],"predecessor-version":[{"id":5585,"href":"https:\/\/www.tarleton.edu\/tieuc\/wp-json\/wp\/v2\/pages\/5581\/revisions\/5585"}],"up":[{"embeddable":true,"href":"https:\/\/www.tarleton.edu\/tieuc\/wp-json\/wp\/v2\/pages\/3625"}],"wp:attachment":[{"href":"https:\/\/www.tarleton.edu\/tieuc\/wp-json\/wp\/v2\/media?parent=5581"}],"curies":[{"name":"wp","href":"https:\/\/api.w.org\/{rel}","templated":true}]}}