{"id":5539,"date":"2025-05-23T16:16:52","date_gmt":"2025-05-23T16:16:52","guid":{"rendered":"https:\/\/www.tarleton.edu\/tieuc\/?page_id=5539"},"modified":"2025-05-23T16:24:15","modified_gmt":"2025-05-23T16:24:15","slug":"housing-family-dynamics","status":"publish","type":"page","link":"https:\/\/www.tarleton.edu\/tieuc\/dashboards\/housing-family-dynamics\/","title":{"rendered":"Housing and Family Dynamics"},"content":{"rendered":"\n<h3 class=\"wp-block-heading\">Housing and Family Dynamics<\/h3>\n\n\n\n<p><strong>&nbsp;Overview<\/strong><\/p>\n\n\n\n<p>This interactive Tableau dashboard enables users to explore&nbsp;<strong>county-specific trends<\/strong>&nbsp;in North Central Texas by&nbsp;<strong>clicking directly on the map<\/strong>. Upon selection, the dashboard dynamically updates to show two key trend lines for the selected county:<\/p>\n\n\n\n<hr class=\"wp-block-separator has-alpha-channel-opacity\"\/>\n\n\n\n<p><strong>&nbsp;Key Features<\/strong><\/p>\n\n\n\n<ul class=\"wp-block-list\">\n<li><strong>Interactive County Map<\/strong>:<br>
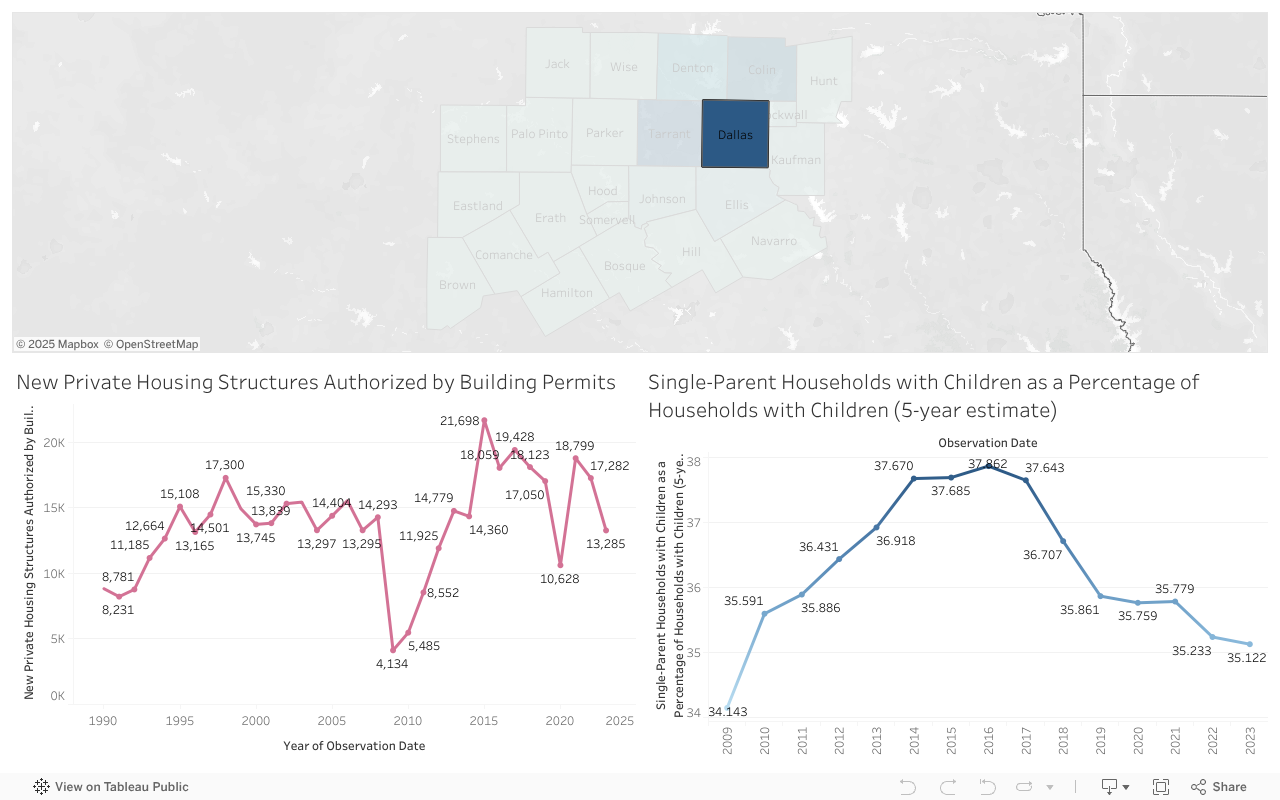
Users can click on any county to update the visualizations below. The map is color-coded to show comparative values (e.g., housing activity) across counties.<\/li>\n\n\n\n<li><strong>Trend Graph 1: New Private Housing Structures Authorized by Building Permits<\/strong><br>This line chart tracks the number of new private housing structures authorized each year, reflecting construction and development patterns from 1990 to the most recent year.<\/li>\n\n\n\n<li><strong>Trend Graph 2: Single-Parent Households with Children (as % of Households with Children)<\/strong><br>This chart provides insight into family structure dynamics by showing the percentage of households with children that are led by single parents over time.<\/li>\n\n\n\n<li><strong>Dynamic Filtering<\/strong>:<br>Clicking a county automatically filters both graphs to display data specific to that location, supporting focused, localized analysis.<\/li>\n<\/ul>\n\n\n\n<hr class=\"wp-block-separator has-alpha-channel-opacity\"\/>\n\n\n\n<p><strong>&nbsp;Key Insights Unlocked by the Dashboard<\/strong><\/p>\n\n\n\n<ul class=\"wp-block-list\">\n<li><strong>Housing Development Trends<\/strong>:<br>Identify growth spurts, construction declines, or recovery years in each county.<\/li>\n\n\n\n<li><strong>Family Structure Patterns<\/strong>:<br>Observe the stability or fluctuation in the proportion of single-parent households, which may reflect social, economic, or policy influences.<\/li>\n\n\n\n<li><strong>County-by-County Comparison<\/strong>:<br>Quickly compare urban vs rural counties by clicking through the map\u2014dense counties (e.g., Dallas, Tarrant) may exhibit sharper fluctuations, while smaller counties show steadier trends.<\/li>\n<\/ul>\n\n\n\n<hr class=\"wp-block-separator has-alpha-channel-opacity\"\/>\n\n\n\n<p><strong>&nbsp;Use Cases<\/strong><\/p>\n\n\n\n<ul class=\"wp-block-list\">\n<li><strong>Urban Planning &amp; Development<\/strong>:<br>Determine where new housing efforts are concentrated or lagging over time.<\/li>\n\n\n\n<li><strong>Social Services &amp; Policy Making<\/strong>:<br>Monitor changing household compositions that may require targeted services or support programs.<\/li>\n\n\n\n<li><strong>Academic or Institutional Research<\/strong>:<br>Provide clean, county-level longitudinal data for researchers analyzing demographic or infrastructure change.<\/li>\n<\/ul>\n\n\n\n<hr class=\"wp-block-separator has-alpha-channel-opacity\"\/>\n\n\n\n<p><strong>&nbsp;How to Use<\/strong><\/p>\n\n\n\n<ol start=\"1\" class=\"wp-block-list\">\n<li><strong>Click on a county<\/strong>&nbsp;from the interactive map.<\/li>\n\n\n\n<li>The two trend graphs below will&nbsp;<strong>instantly update<\/strong>&nbsp;to reflect data for the selected county only.<\/li>\n\n\n\n<li>Hover over data points for exact yearly values.<\/li>\n\n\n\n<li>Click another county to compare \u2014 no need to reset manually.<\/li>\n<\/ol>\n\n\n\n<div class='tableauPlaceholder' id='viz1748016990360' style='position: relative'><noscript><a href='#'><img alt='Dashboard 1 ' src='https:&#47;&#47;public.tableau.com&#47;static&#47;images&#47;7B&#47;7BQ5MB6CK&#47;1_rss.png' style='border: none' \/><\/a><\/noscript><object class='tableauViz'  style='display:none;'><param name='host_url' value='https%3A%2F%2Fpublic.tableau.com%2F' \/> <param name='embed_code_version' value='3' \/> <param name='path' value='shared&#47;7BQ5MB6CK' \/> <param name='toolbar' value='yes' \/><param name='static_image' value='https:&#47;&#47;public.tableau.com&#47;static&#47;images&#47;7B&#47;7BQ5MB6CK&#47;1.png' \/> <param name='animate_transition' value='yes' \/><param name='display_static_image' value='yes' \/><param name='display_spinner' value='yes' \/><param name='display_overlay' value='yes' \/><param name='display_count' value='yes' \/><param name='language' value='en-US' \/><\/object><\/div>                <script type='text\/javascript'>                    var divElement = document.getElementById('viz1748016990360');                    var vizElement = divElement.getElementsByTagName('object')[0];                    if ( divElement.offsetWidth > 800 ) { vizElement.style.width='100%';vizElement.style.height=(divElement.offsetWidth*0.75)+'px';} else if ( divElement.offsetWidth > 500 ) { vizElement.style.width='100%';vizElement.style.height=(divElement.offsetWidth*0.75)+'px';} else { vizElement.style.width='100%';vizElement.style.height='927px';}                     var scriptElement = document.createElement('script');                    scriptElement.src = 'https:\/\/public.tableau.com\/javascripts\/api\/viz_v1.js';                    vizElement.parentNode.insertBefore(scriptElement, vizElement);                <\/script>\n","protected":false},"excerpt":{"rendered":"<p>Housing and Family Dynamics &nbsp;Overview This interactive Tableau dashboard enables users to explore&nbsp;county-specific trends&nbsp;in North Central Texas by&nbsp;clicking directly on the map. Upon selection, the dashboard dynamically updates to show &#8230;<\/p>\n","protected":false},"author":689,"featured_media":0,"parent":3625,"menu_order":0,"comment_status":"closed","ping_status":"closed","template":"template-fullwidth.php","meta":{"_acf_changed":false,"inline_featured_image":false,"advgb_blocks_editor_width":"","advgb_blocks_columns_visual_guide":"","footnotes":""},"class_list":["post-5539","page","type-page","status-publish","hentry"],"acf":[],"coauthors":[],"author_meta":{"author_link":"https:\/\/www.tarleton.edu\/tieuc\/author\/bkurdle\/","display_name":"Webmaster"},"relative_dates":{"created":"Posted 11 months ago","modified":"Updated 11 months ago"},"absolute_dates":{"created":"Posted on May 23, 2025","modified":"Updated on May 23, 2025"},"absolute_dates_time":{"created":"Posted on May 23, 2025 4:16 pm","modified":"Updated on May 23, 2025 4:24 pm"},"featured_img_caption":"","featured_img":false,"series_order":"","_links":{"self":[{"href":"https:\/\/www.tarleton.edu\/tieuc\/wp-json\/wp\/v2\/pages\/5539","targetHints":{"allow":["GET"]}}],"collection":[{"href":"https:\/\/www.tarleton.edu\/tieuc\/wp-json\/wp\/v2\/pages"}],"about":[{"href":"https:\/\/www.tarleton.edu\/tieuc\/wp-json\/wp\/v2\/types\/page"}],"author":[{"embeddable":true,"href":"https:\/\/www.tarleton.edu\/tieuc\/wp-json\/wp\/v2\/users\/689"}],"replies":[{"embeddable":true,"href":"https:\/\/www.tarleton.edu\/tieuc\/wp-json\/wp\/v2\/comments?post=5539"}],"version-history":[{"count":3,"href":"https:\/\/www.tarleton.edu\/tieuc\/wp-json\/wp\/v2\/pages\/5539\/revisions"}],"predecessor-version":[{"id":5545,"href":"https:\/\/www.tarleton.edu\/tieuc\/wp-json\/wp\/v2\/pages\/5539\/revisions\/5545"}],"up":[{"embeddable":true,"href":"https:\/\/www.tarleton.edu\/tieuc\/wp-json\/wp\/v2\/pages\/3625"}],"wp:attachment":[{"href":"https:\/\/www.tarleton.edu\/tieuc\/wp-json\/wp\/v2\/media?parent=5539"}],"curies":[{"name":"wp","href":"https:\/\/api.w.org\/{rel}","templated":true}]}}